Helium’s long volatility trades buy more closer-to-the-money options and sell fewer further-out-of-the-money options. You pay a net debit. You lose that debit if the stock doesn’t move. But if it does move, the extra long options create an asymmetric payoff — small, defined loss vs potentially large gain. See the short volatility version of this post.
Does the math actually work?
We ran 5,000 Monte Carlo simulations to find out.
The Strategy
Ratio Debit Spread (2x1): Buy two closer-to-money calls, sell one further-OTM call. You pay a net debit, but you own an extra long option. Past the short strike, that extra option keeps gaining — uncapped upside.
1x1 Debit Spread: Buy one, sell one. Cheaper entry, but profit is capped at the spread width.
Naked Long: Just buy calls. Maximum gamma, but you pay full price with no offset.
Payoff at Expiry
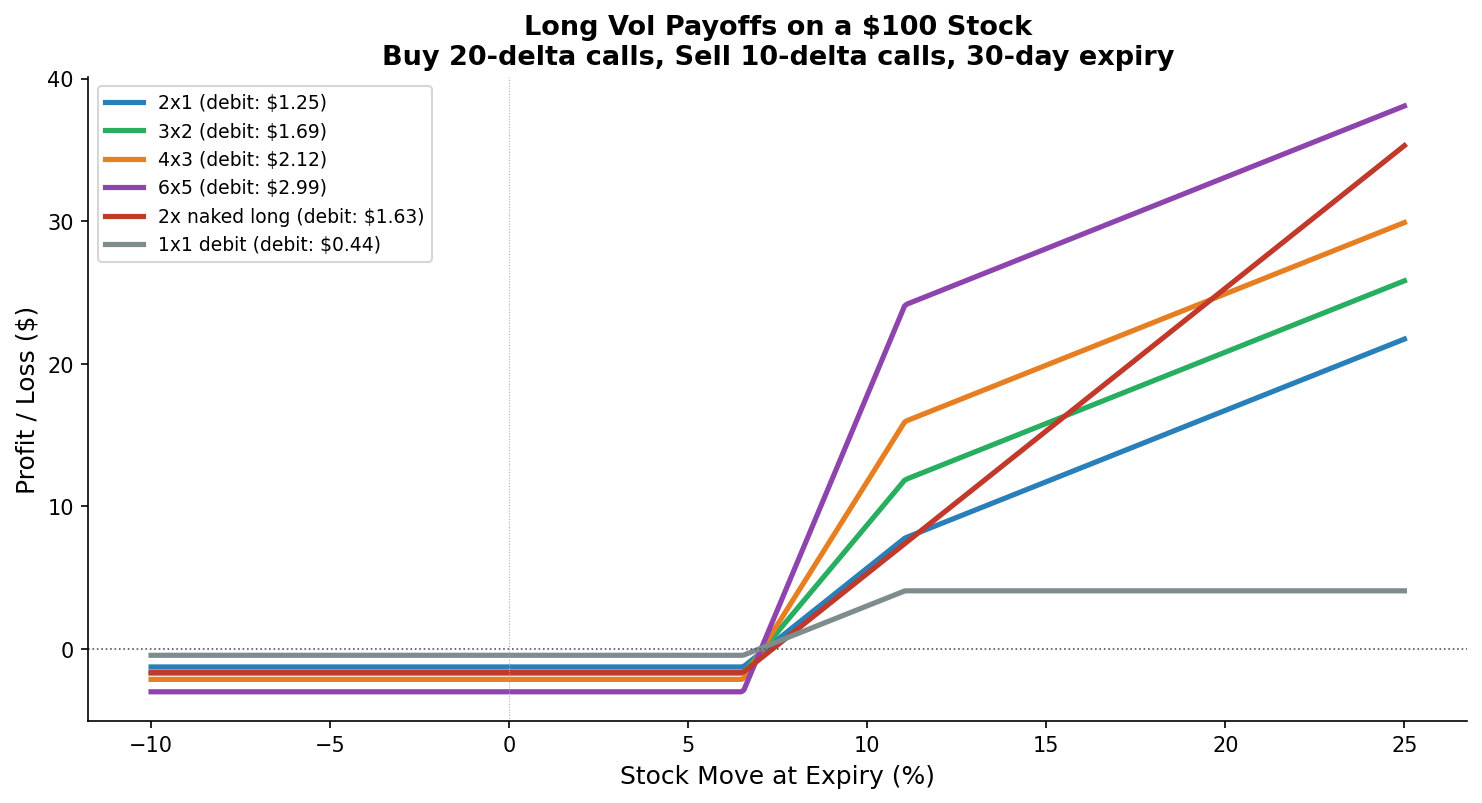
If the stock hasn’t moved at expiry, every strategy loses its full debit. The 1x1 caps out quickly. The ratio spread keeps gaining past the short strike.
Simulation Setup
-
5,000 portfolios, $100k each, 2% risk per trade
-
New trade every 5 business days (~50/year), 30-day duration
-
5% entry cost + 3% closing cost (bid-ask + commissions)
-
2% Variance Risk Premium — options priced at 20% IV, stock moves at 18% realized vol. This is the structural headwind: you pay for more movement than you get.
-
Fat-tailed returns (Student’s t, df=5) with autocorrelation. Options priced with Black-Scholes (thin tails), but real returns have fat tails.
Part 1: Which Ratio Wins?
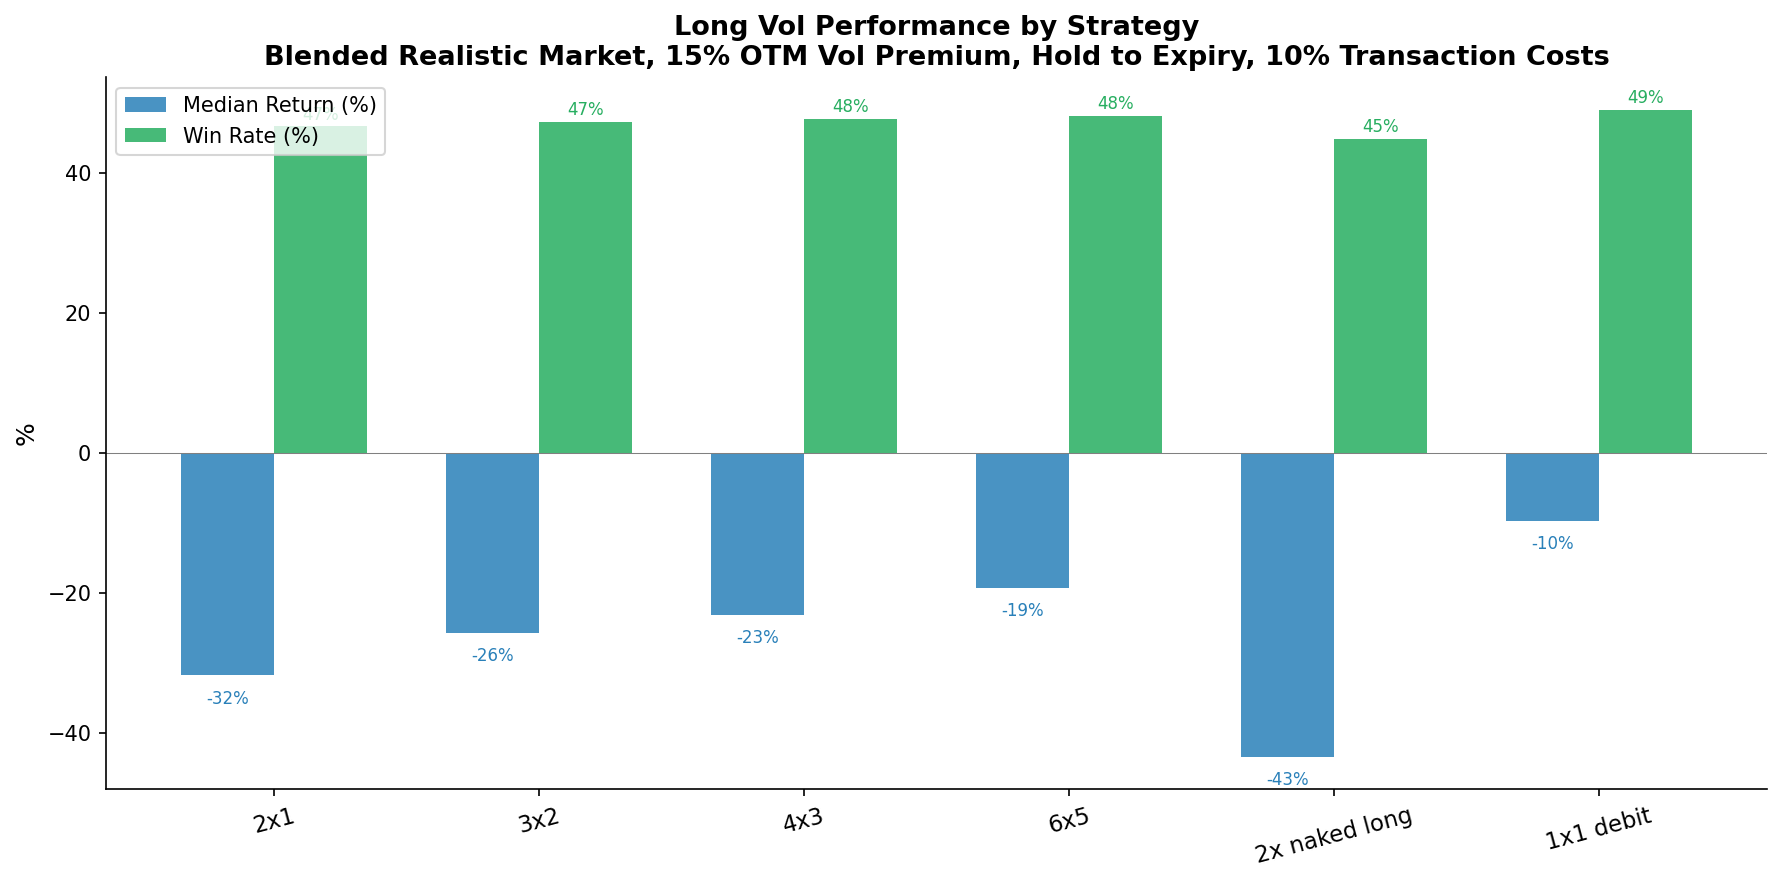
All held to expiry, 20-delta buy / 10-delta sell:
| Strategy | Median Return | Win Rate |
|---|---|---|
| 1x1 Debit Spread | -10% | 49% |
| 6x5 Ratio | -19% | 48% |
| 4x3 Ratio | -23% | 48% |
| 3x2 Ratio | -26% | 47% |
| 2x1 Ratio | -32% | 47% |
| 2x Naked Long | -43% | 45% |
Held to expiry, everything loses. The Variance Risk Premium means you systematically overpay for options. More net long options = more gamma per dollar = less loss. But hold-to-expiry is the wrong approach for long vol. Part 2 changes everything.
Part 2: Profit-Taking Changes Everything
Most winning long vol trades peak mid-trade, then theta decays them back to zero. The key is locking in gains before that happens.
PT = take profit when gain reaches X% of the debit paid. No stop loss.
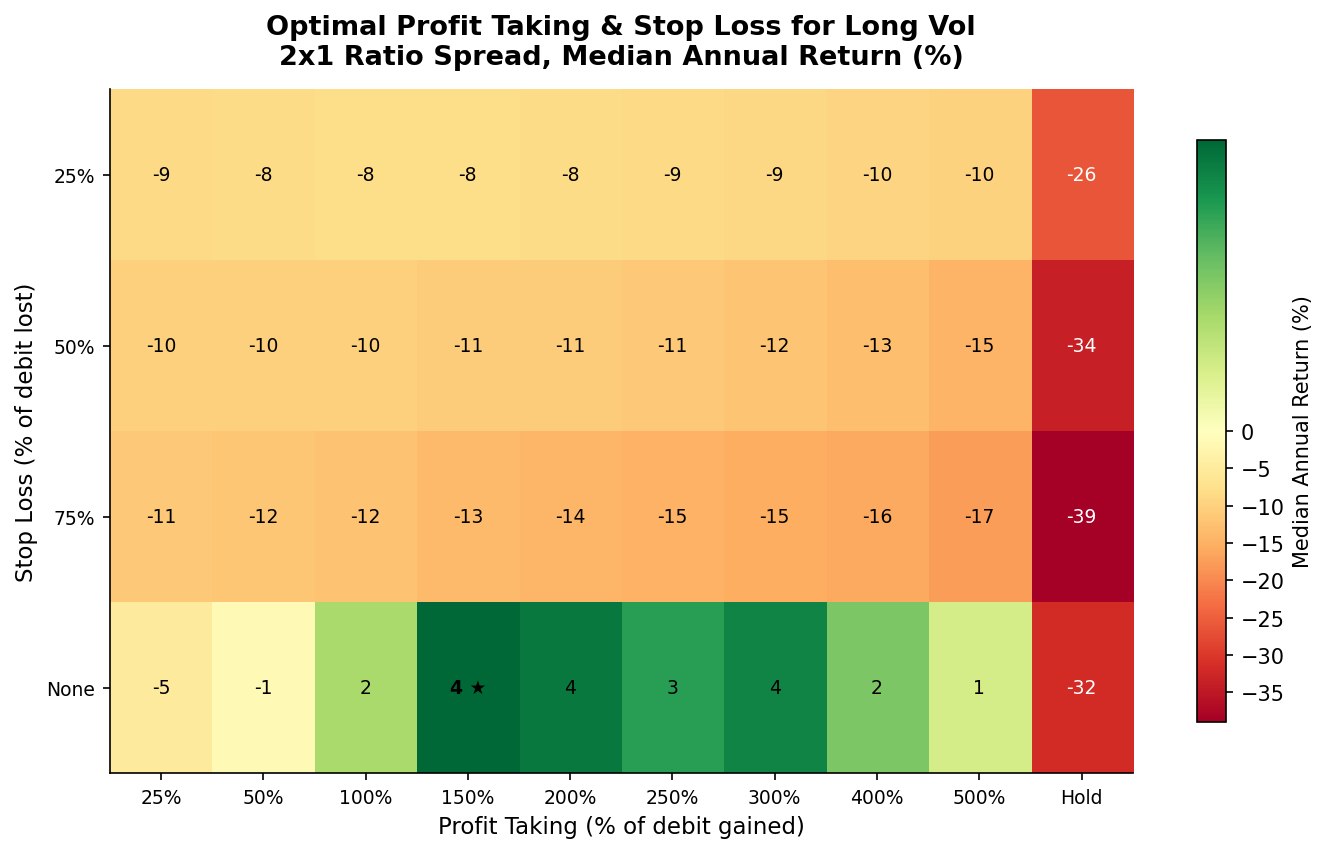
Using a 2x1 ratio spread (20/10 deltas):
| Profit Target | Median Return | Win Rate | Worst 5% |
|---|---|---|---|
| Hold to expiry | -32% | 47% | -100% |
| PT = 50% | -2% | 49% | -52% |
| PT = 100% | +2% | 50% | -66% |
| PT = 150% | +4% | 51% | -76% |
| PT = 200% | +4% | 51% | -82% |
| PT = 300% | +4% | 51% | -90% |
| PT = 500% | +1% | 50% | -98% |
Profit-taking swings results by 36 percentage points. From -32% (hold) to +4% (PT=150%). The sweet spot is PT = 150% — take profit when your gain reaches 1.5x the debit you paid.
But +4% with 20/10 deltas is modest. The real edge comes from choosing better deltas.
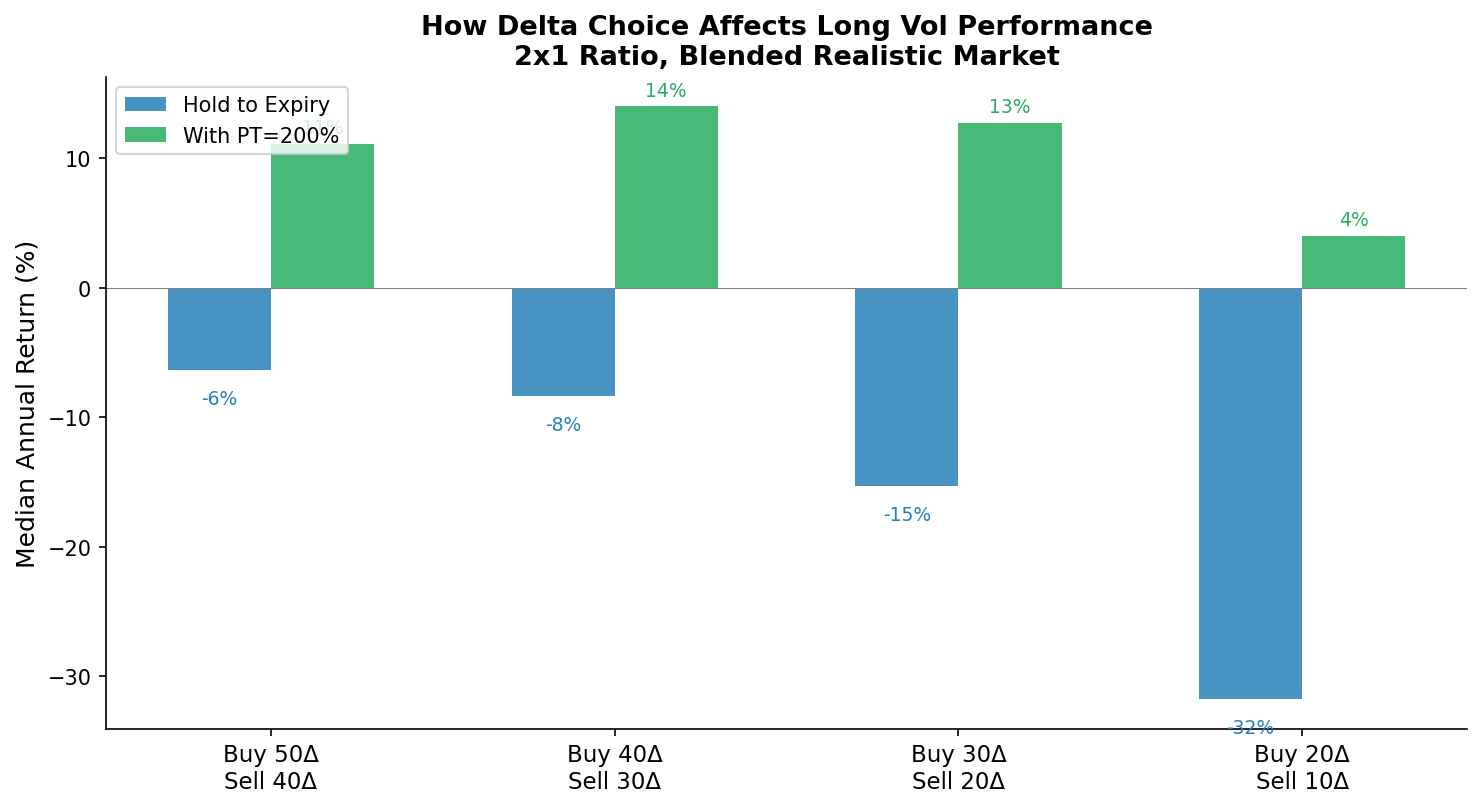
Part 3: Which Deltas Should You Trade?
This is the most important finding. We tested four delta pairs, all as 2x1 ratio spreads with PT=150%:
| Buy / Sell | Strikes (OTM) | Debit | Hold | With PT=150% | Win Rate |
|---|---|---|---|---|---|
| 50Δ / 40Δ | 0.3% / 2.4% | $3.34 | -6% | +11% | 53% |
| 40Δ / 30Δ | 2.1% / 4.6% | $2.50 | -8% | +14% | 54% |
| 30Δ / 20Δ | 4.1% / 7.2% | $1.79 | -15% | +13% | 54% |
| 20Δ / 10Δ | 6.5% / 11.1% | $1.19 | -32% | +4% | 51% |
Using the best pair (30/20) across PT levels:
| Profit Target | Median Return | Win Rate |
|---|---|---|
| PT = 50% | +4% | 52% |
| PT = 100% | +10% | 54% |
| PT = 150% | +13% | 54% |
| PT = 200% | +13% | 53% |
| PT = 300% | +10% | 52% |
| PT = 500% | 0% | 50% |
Closer-to-the-money options dramatically outperform far-OTM. The 40/30 and 30/20 pairs return +13-14% with PT=150%, versus +4% for 20/10. A 3-5% stock move puts 30-40 delta options in the money. The 20/10 pair needs a 7%+ move, which happens far less often.
The 50/40 pair underperforms slightly (+11%) because the options are nearly ATM — expensive and the spread is narrow, reducing convexity.
The answer: buy 30-40 delta, sell 20-30 delta, take profit at 150% of debit.
Part 4: When Does Long Vol Win?
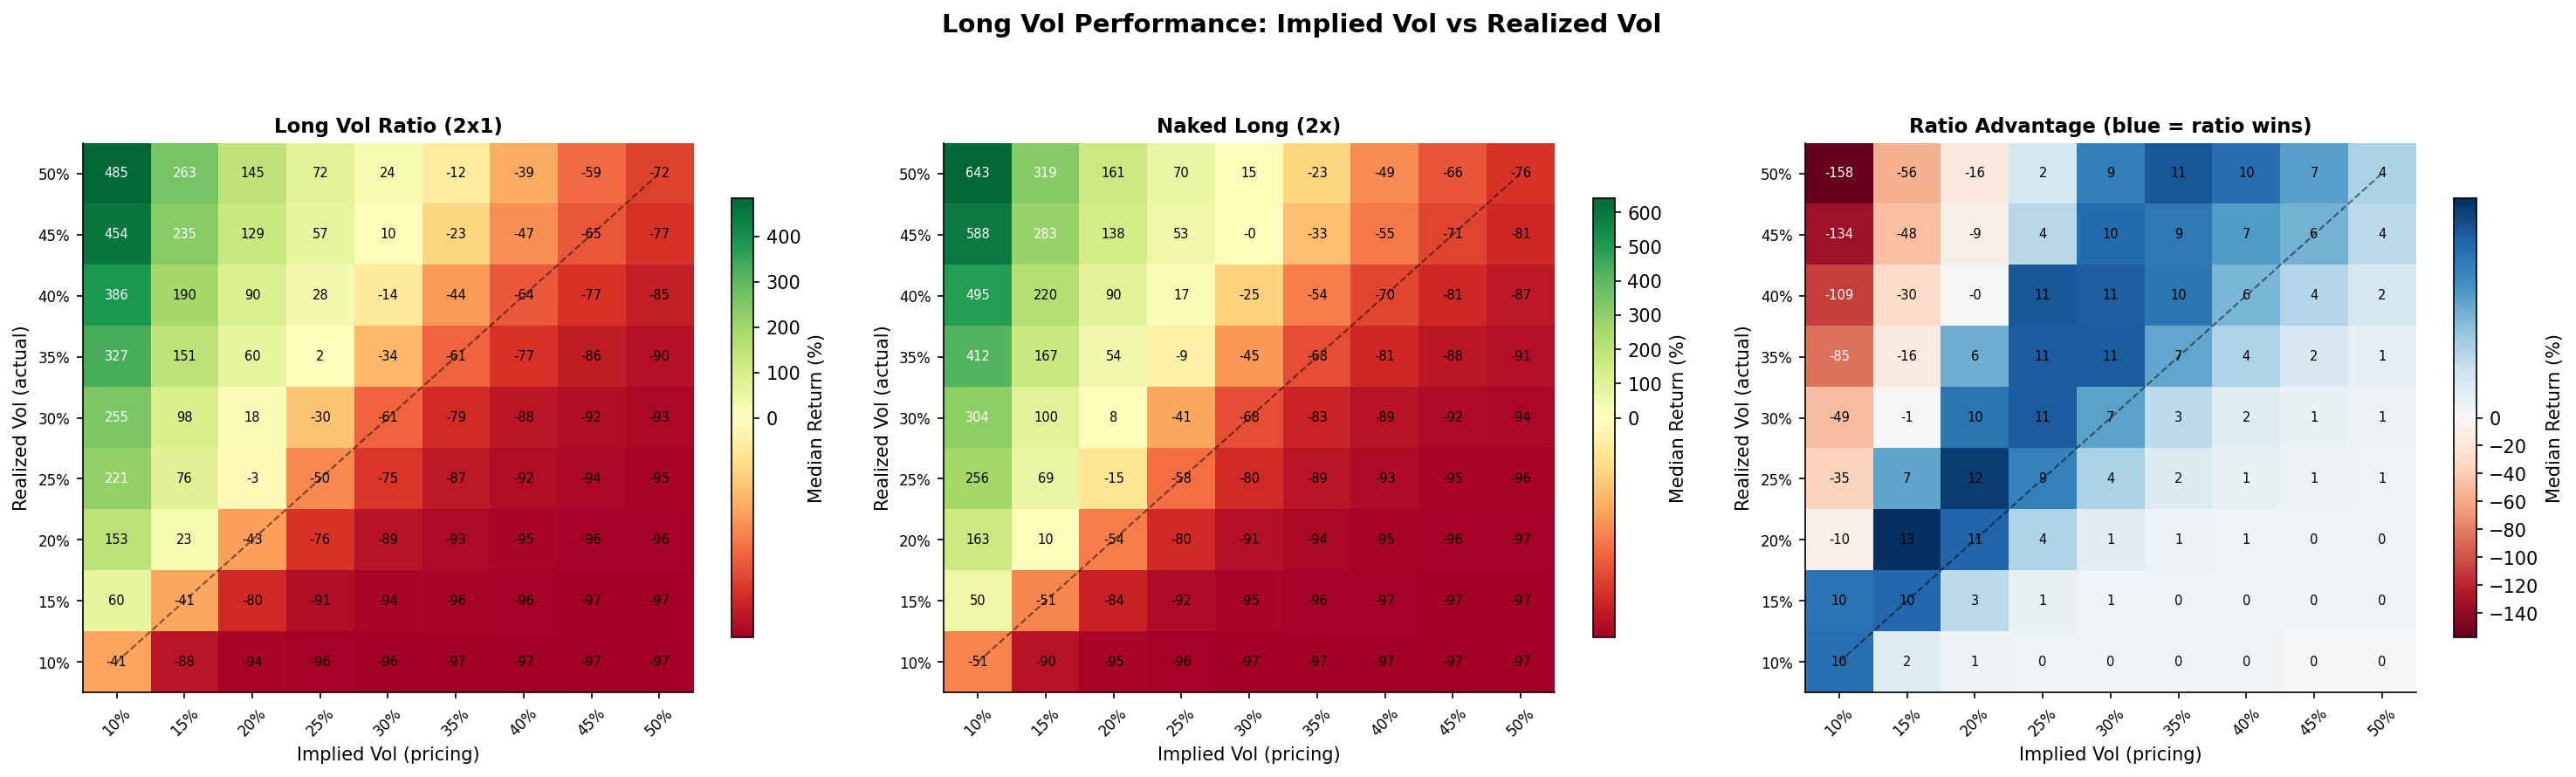
Long vol wins when realized vol exceeds implied vol (above the diagonal). Long vol loses when the stock is calmer than expected (below the diagonal) — the default state of the market.
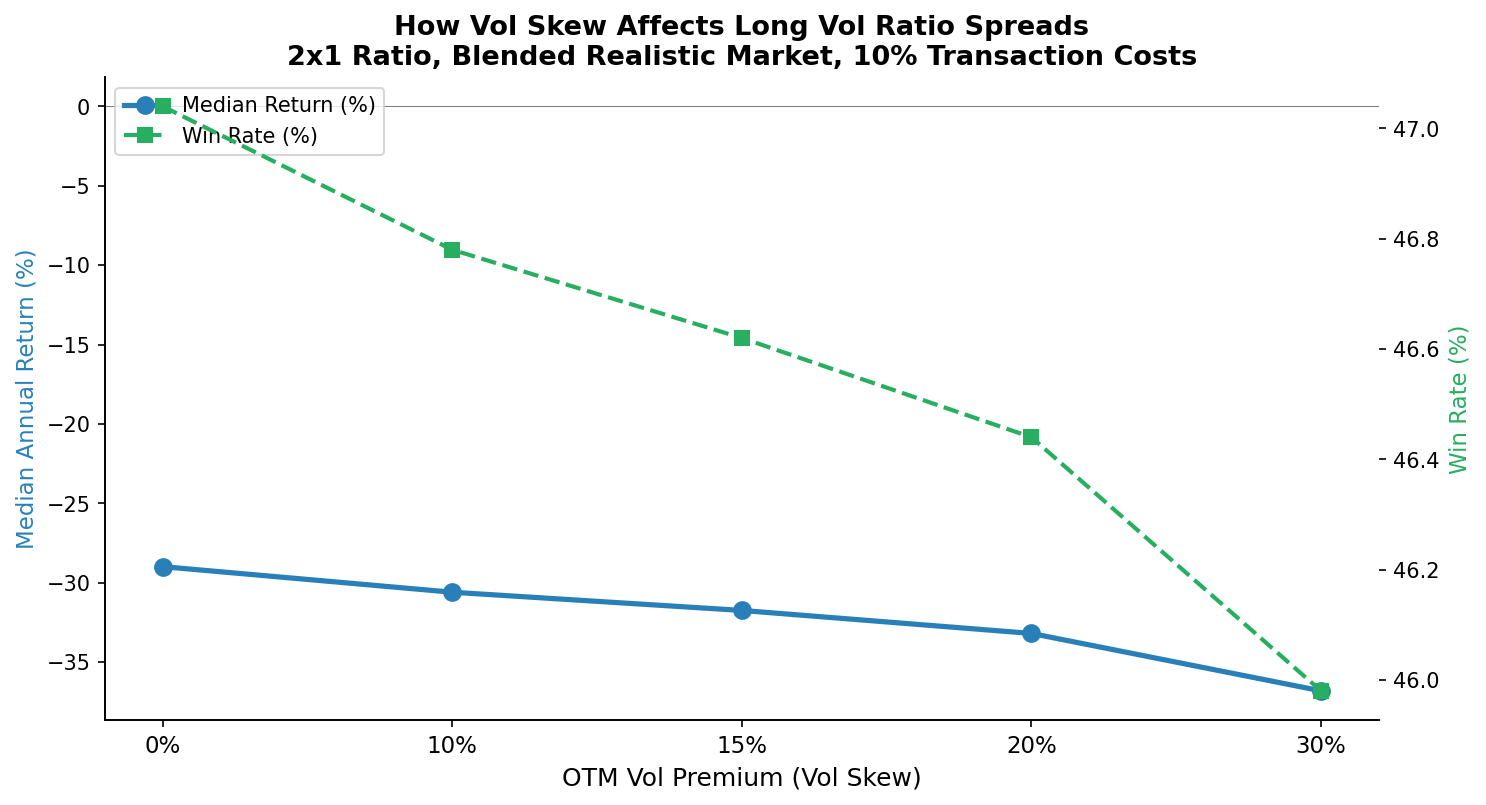
Part 5: Skew and Duration
Vol skew hurts long vol. You buy 2 options with some skew premium and sell only 1 with full skew premium. More skew = higher debit = worse returns. Look for underlyings with flatter skew.
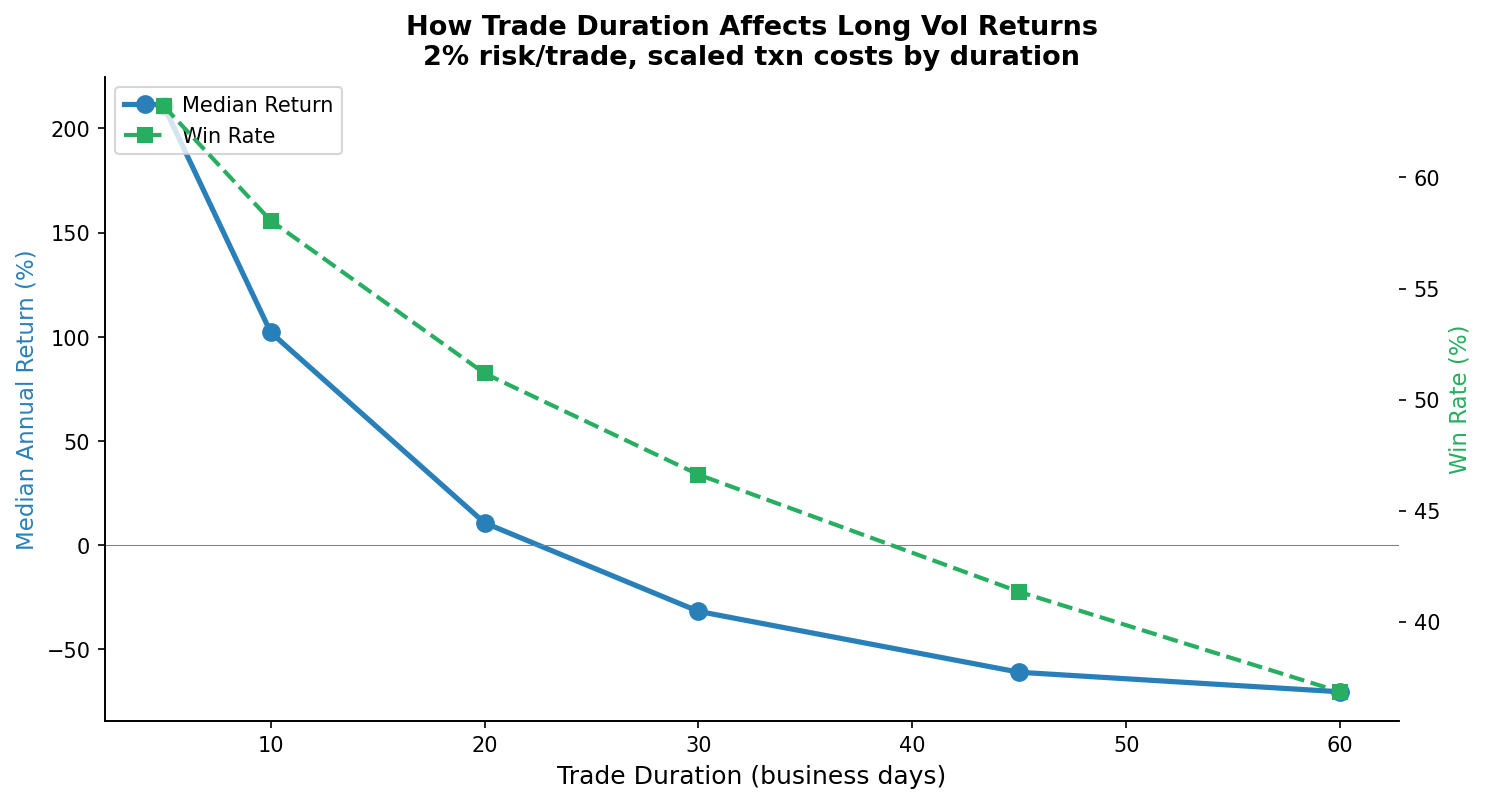
Shorter duration = more gamma per dollar, but harder to execute. 20-day options show +11% median. 5-day options show +211% but with 25% transaction costs and near-zero liquidity. The realistic sweet spot is 20-30 days.
Summary
| Metric | 20/10 Hold | 20/10 + PT | 30/20 + PT | 40/30 + PT |
|---|---|---|---|---|
| Median Return | -32% | +4% | +13% | +14% |
| Win Rate | 47% | 51% | 54% | 54% |
| Worst 5% | -100% | -76% | -75% | -77% |
The Simple Version
-
Buy 30-40 delta. Sell 20-30 delta. Closer-to-the-money options profit from smaller moves, which happen more often.
-
Take profit at 150% of the debit. If you paid $2, close when you’re up $3. This captures the fat-tail spike before theta decays it.
-
No stop loss. Long vol positions frequently dip before paying off. Size smaller if you want less risk.
-
Long vol is a modest edge, not a free lunch. +13% with optimal settings. The edge comes from fat-tailed returns that options pricing doesn’t fully capture.
Helium’s Long Volatility Trades use ratio spreads with closer-to-money deltas, aggressive profit-taking, and conservative sizing to capture asymmetric payoffs.
Methodology: 5,000 Monte Carlo simulations, trades every 5 days (~50/year), 2% risk per trade, 5% entry + 3% closing costs. IV=20%, RV=18% (2% VRP). Vol skew: 15% for far-OTM, ~4.5% for near-OTM. Fat tails (Student’s t, df=5), autocorrelation (phi=0.15). Deltas tested: 50/40, 40/30, 30/20, 20/10. PT tested: 25%-500%. Duration: 5-60 days with scaled costs.
Disclaimer: Options trading involves significant risk. This is educational, not financial advice. Simulated performance does not guarantee future results. The Variance Risk Premium is a structural headwind for long vol.