Helium trades ratio backspreads: sell one near-ATM option, buy two far-OTM options. You collect a credit if the market stays quiet, and you profit from large moves because of the extra long option. See the long volatility version of this post.
But does the math actually work? When does it work — and when doesn’t it? And how should you manage the trades?
We ran 5,000 Monte Carlo simulations to find out.
The Strategy
Traditional 1x1 Spread: Sell one 50-delta (ATM) call, buy one 10-delta (OTM) call. You keep the credit if the stock stays flat. You take max loss if it rallies past the OTM strike.
1x2 Ratio Spread: Sell one 50-delta call, buy two 10-delta calls. You collect a smaller credit (you’re buying an extra option), but that extra long call gives you convexity — if the market rallies hard, you profit instead of taking max loss.
Both strategies are net short vega — both profit from selling overpriced implied volatility when the stock stays flat. The difference is what happens when the stock moves. The traditional spread is capped at max loss. The ratio spread recovers and eventually profits, because the two long options outpace the one short option. That second long option is the gamma. It costs you credit up front, but it pays off when the stock moves enough.
The Payoff Difference
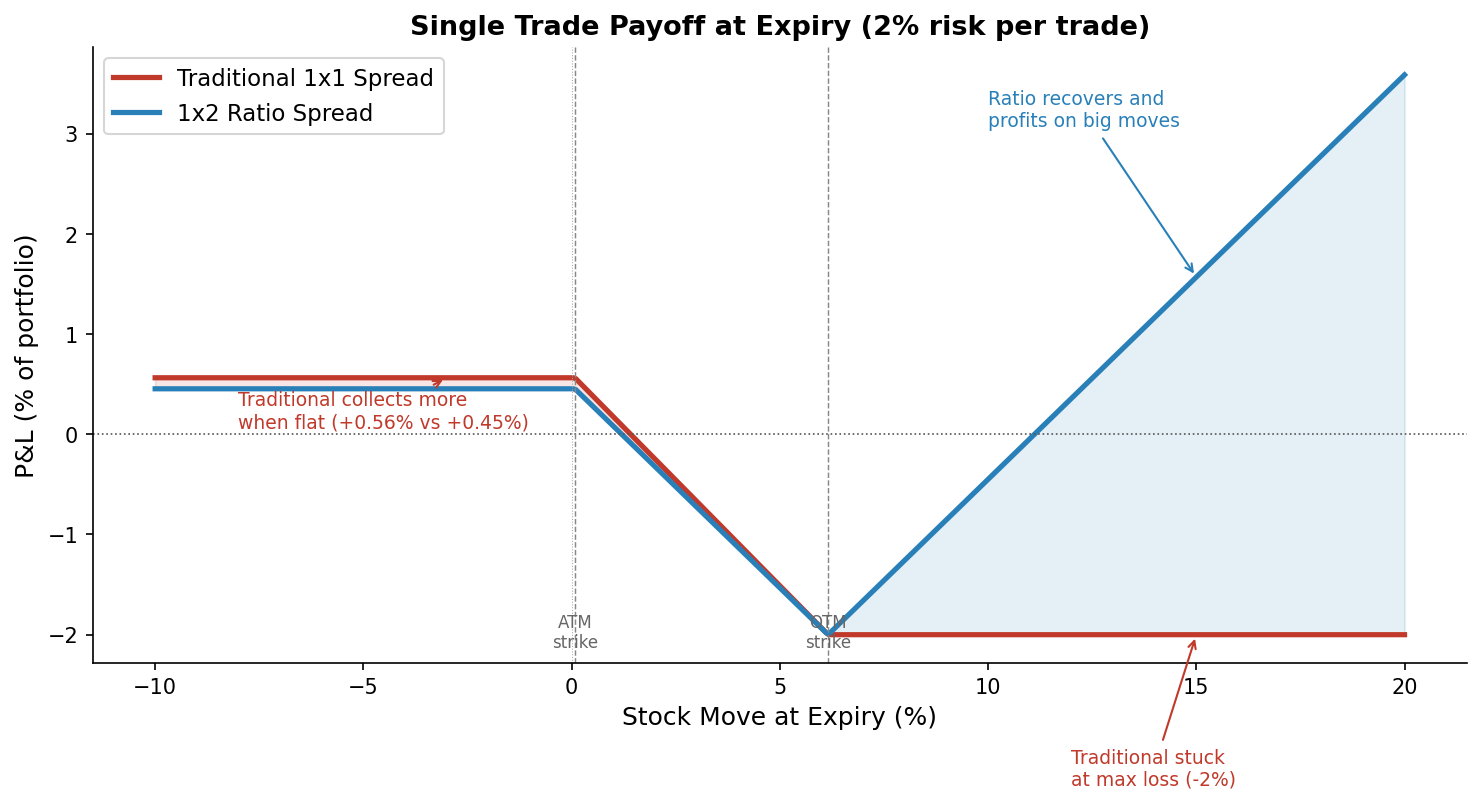
Both payoffs are shown as % of a $100k portfolio (2% risk per trade). Notice the traditional spread collects slightly more when flat (+0.56% vs +0.45%) — that’s the cost of the extra option. Both have -2% max loss. But past the OTM strike, the traditional stays at max loss while the ratio spread recovers and shoots higher.
Over hundreds of trades, those recoveries compound.
Simulation Setup
-
5,000 portfolios, $100k each, risking 2% per trade
-
New trade every 2 business days (~126 trades/year, ~5 overlapping at once)
-
10% round-trip transaction costs (bid-ask spread + commissions, as a % of credit)
-
Black-Scholes pricing with OTM vol premium (tested at 0%, 10%, 15%, 20%, and 30%)
-
Blended Realistic market model for Parts 2-5: fat-tailed daily returns (Student’s t, df=5) with mild positive autocorrelation (phi=0.15). Part 1 sweeps across all IV/RV combinations.
Part 1: When Does Each Strategy Win?
Instead of testing one market condition, we swept across every combination of implied volatility and realized volatility to map exactly when each strategy has the edge.
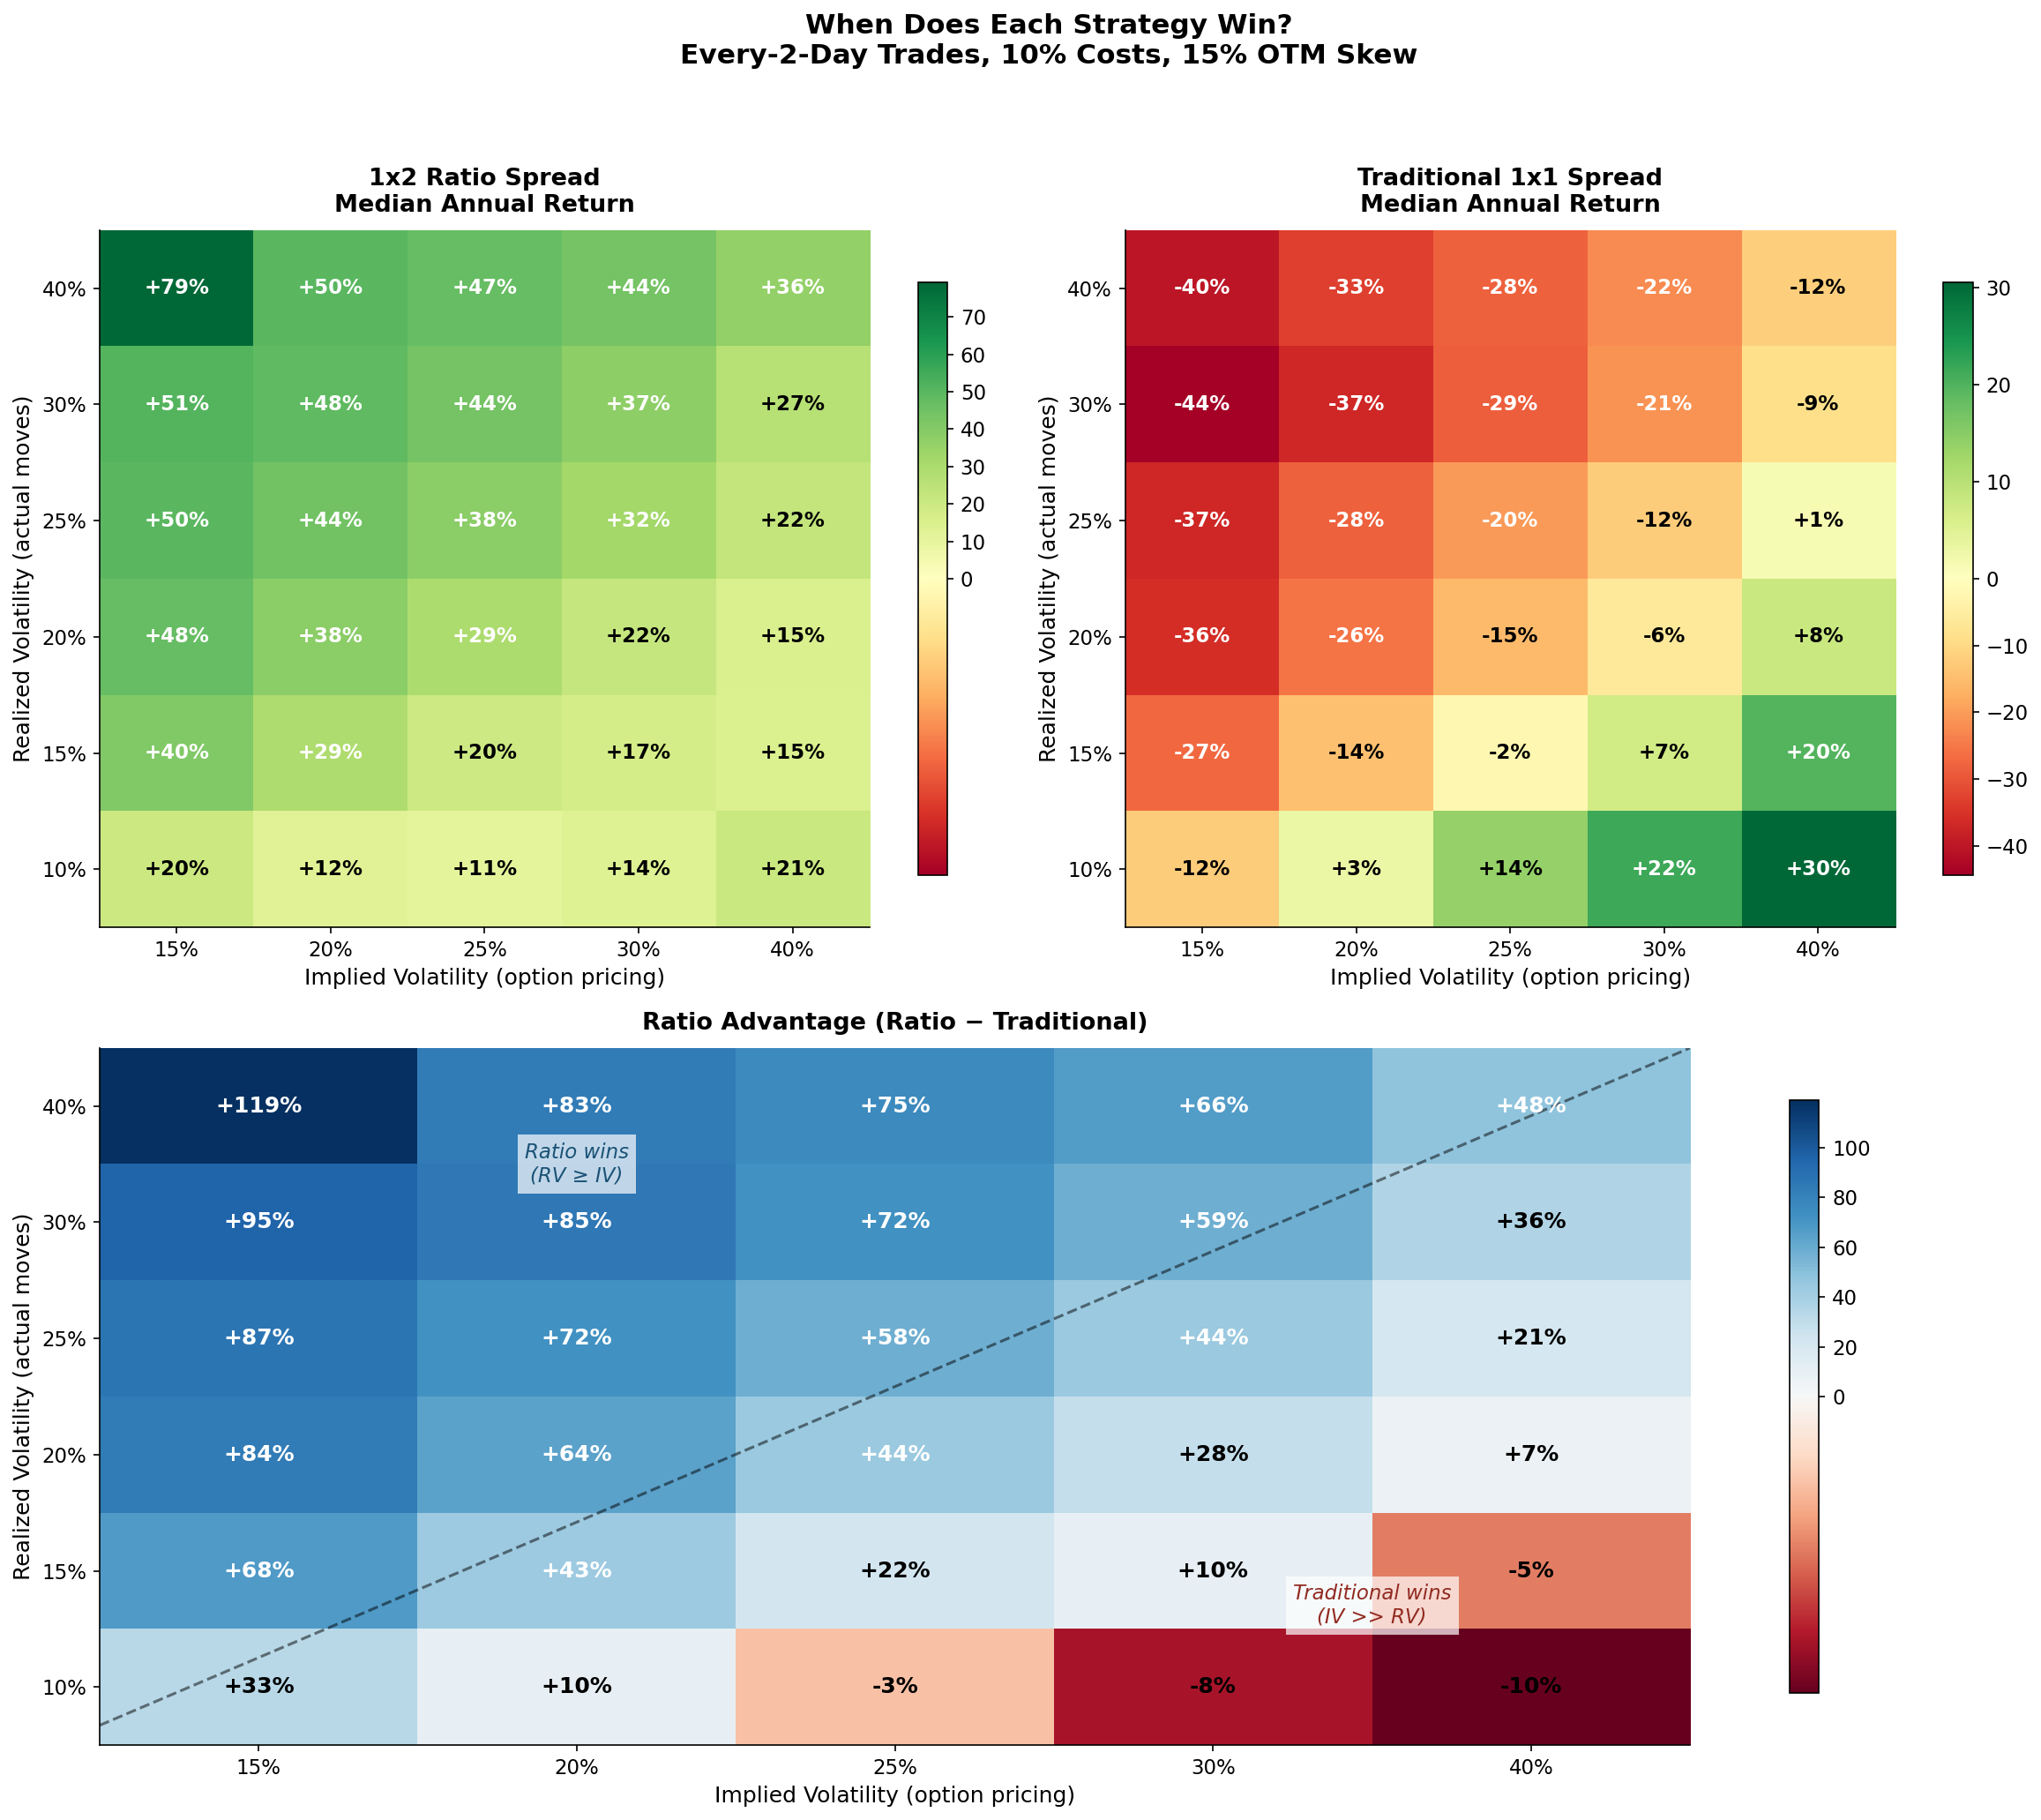
The top panels show each strategy’s returns separately. The bottom panel shows the ratio spread’s advantage: blue = ratio wins, red = traditional wins. The dashed line marks where implied vol equals realized vol.
Ratio spreads win when the market actually moves (above the diagonal). When realized vol meets or exceeds implied vol, the extra long option pays off. This covers most of the chart.
Traditional spreads win when the market stays calmer than expected (below the diagonal). When IV=40% but the stock only realizes 10% volatility, the traditional spread returns +31% while the ratio spread returns +21%. You paid for gamma that never triggered.
Intuitively:
-
Ratio spread = you want the stock to move. The extra option is wasted in dead calm markets.
-
Traditional spread = you want the stock to sit still. Your max credit is your max profit — big moves only hurt.
In real markets, implied vol usually overstates realized moves (the variance risk premium). Both strategies benefit from that. But the ratio spread has a second edge: when vol occasionally understates a move (tail events, gap moves), the extra long option turns a max loss into a profit.
Practically: for a low-beta utility stock in a quiet market, the traditional spread may be the better choice. For high-beta stocks, earnings events, or macro uncertainty where occasional large moves are likely, the ratio spread’s convexity is worth the cost.
Part 2: How Vol Skew Affects the Edge
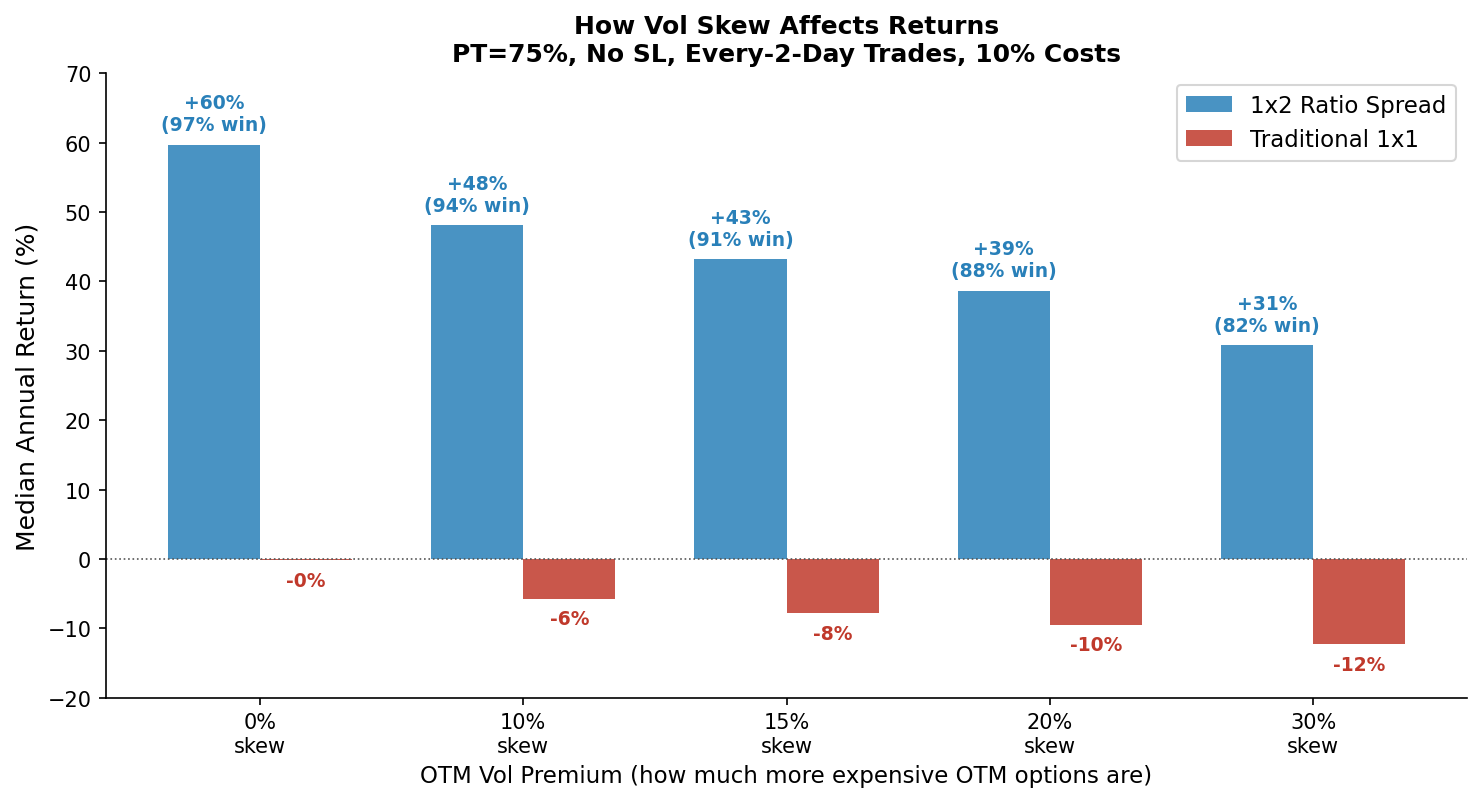
In real markets, OTM options trade at a premium to ATM options — this is the volatility skew. The more expensive OTM options are, the more you pay for that extra long in the ratio spread.
| OTM Vol Premium | Ratio Return | Trad Return | Ratio Win Rate |
|---|---|---|---|
| 0% (flat vol) | +60% | 0% | 97% |
| 10% | +48% | -6% | 94% |
| 15% (typical) | +43% | -8% | 91% |
| 20% | +39% | -10% | 88% |
| 30% (steep) | +31% | -12% | 82% |
The ratio spread is profitable at every skew level tested, but the edge shrinks as skew increases. At 30% OTM vol premium (steep skew), the ratio spread still returns +31% with an 82% win rate. The traditional spread loses money at every skew level except flat vol.
Intuitively: higher skew means you’re paying more for the extra long option. But as long as the stock occasionally moves enough to trigger the convexity payoff, the ratio spread still comes out ahead.
Part 3: Optimal Profit-Taking & Stop Loss
We tested every combination of profit-taking (10% to 100%+ of credit) and stop loss (10% to 300%+ of credit, or none).
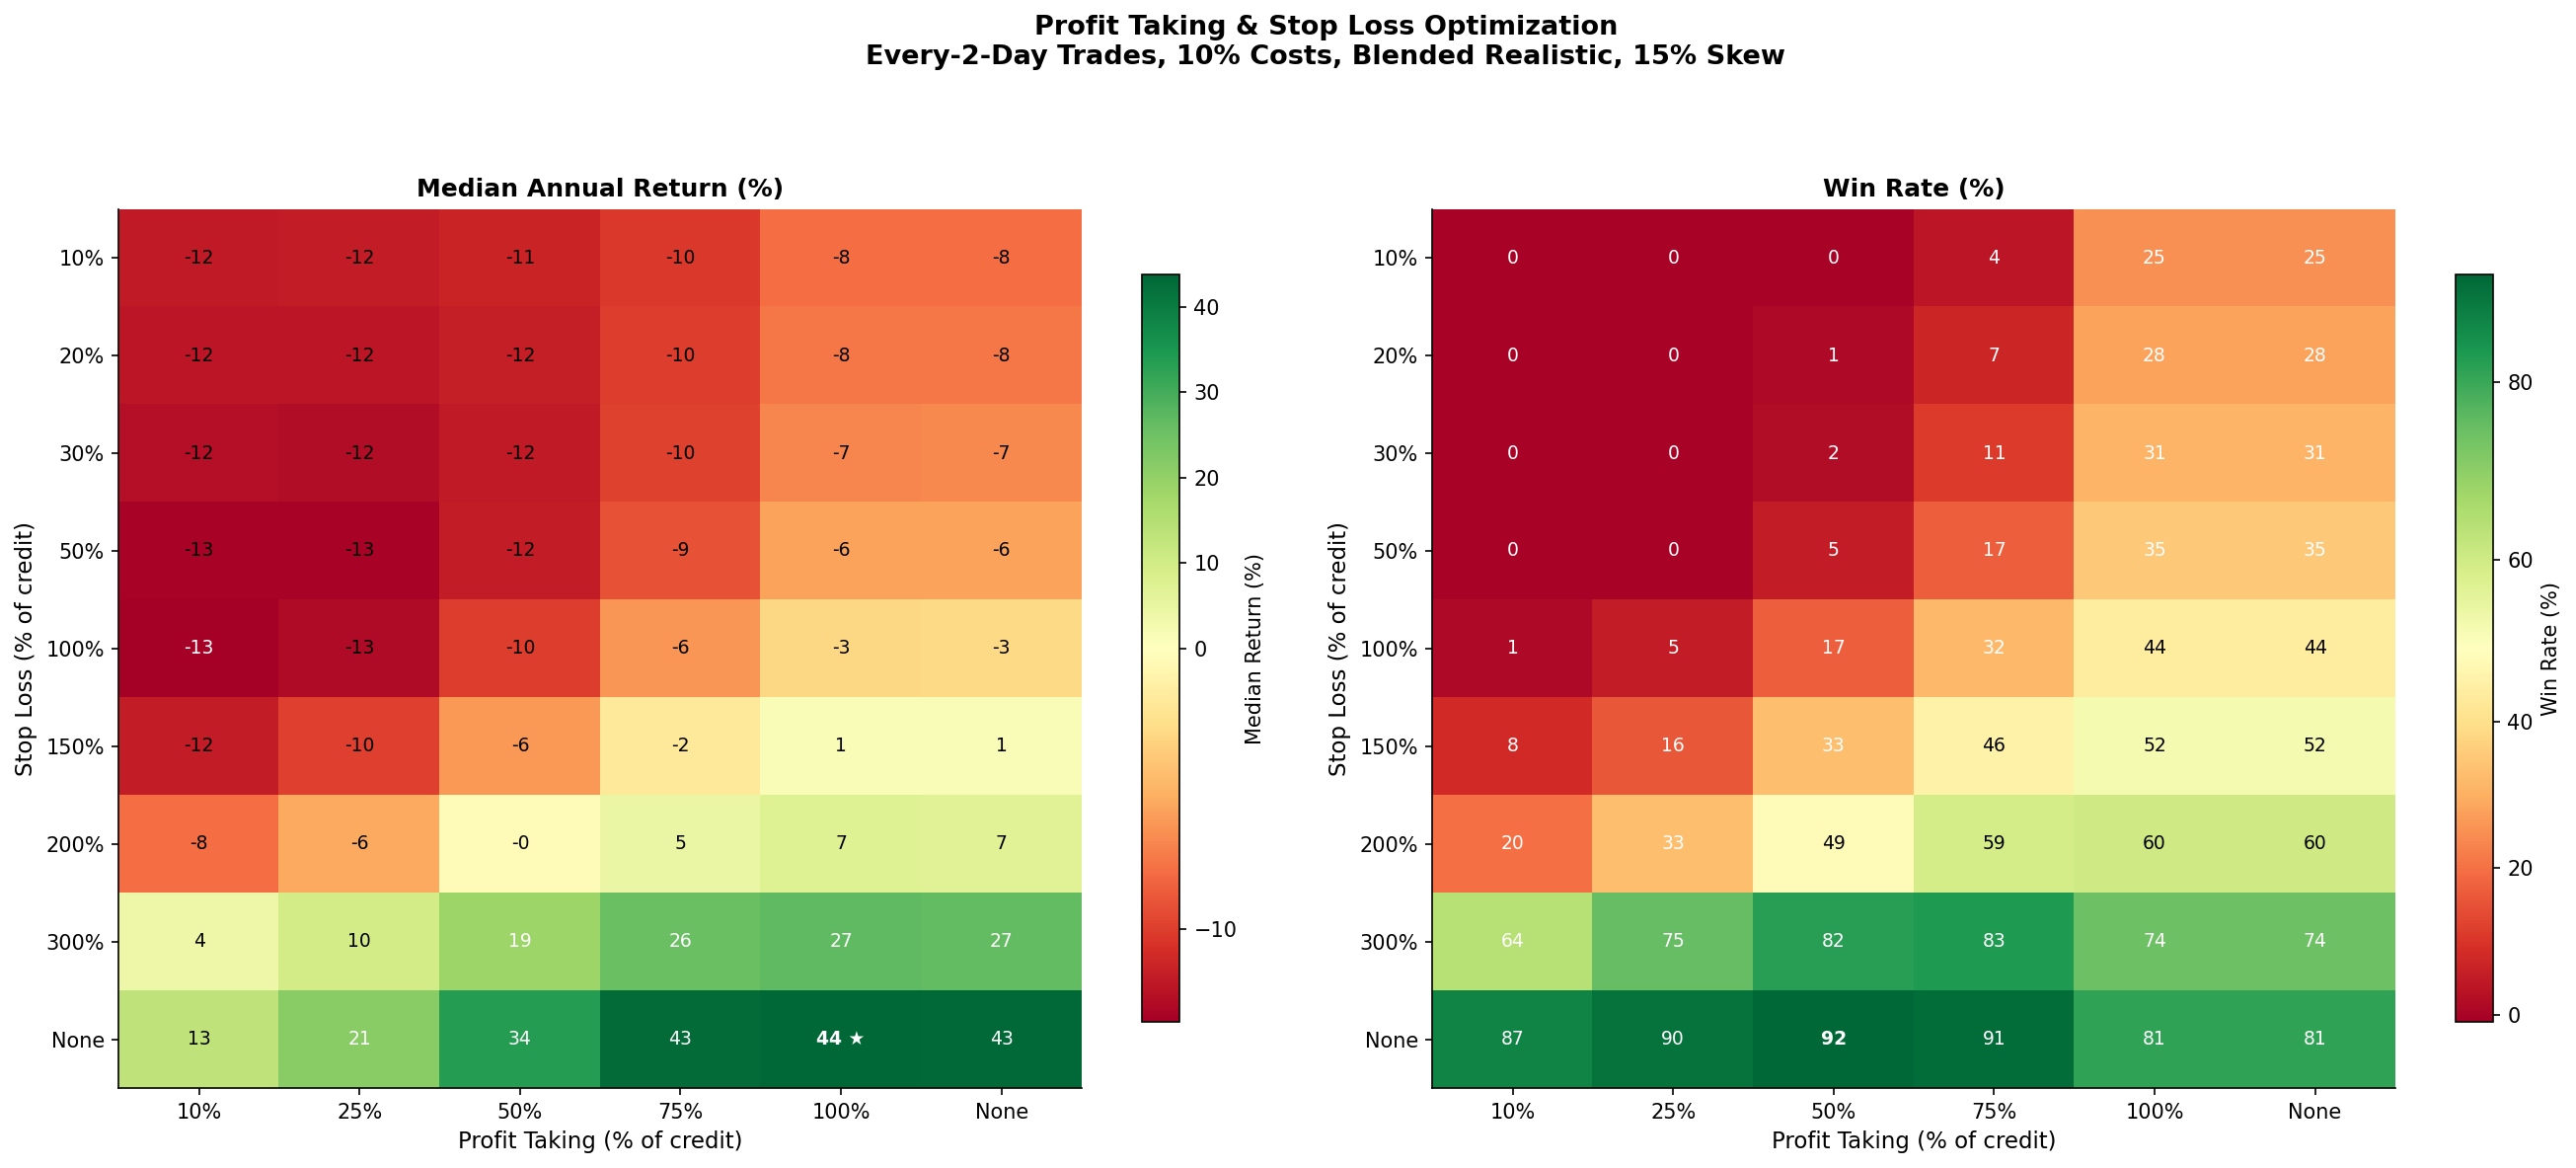
The highest raw return is PT=100%, no stop loss (+44%). But the best risk-adjusted combination is PT=75% of credit, no stop loss:
| Metric | PT=75%, No SL | PT=100%, No SL | Hold to Expiry |
|---|---|---|---|
| Median Return | +43% | +44% | +43% |
| Win Rate | 91% | 81% | 81% |
| Worst 5% | -11% | -45% | -45% |
PT=75% gives up just 1% of median return but has a dramatically better worst case (-11% vs -45%) and a 91% win rate instead of 81%.
Why? Taking profits at 75% locks in the gain on the most common outcome (stock stays flat, theta decays your short leg) before the trade has time to reverse. The remaining 25% of credit you leave on the table is the cost of a much tighter distribution.
The density plot makes this visible:
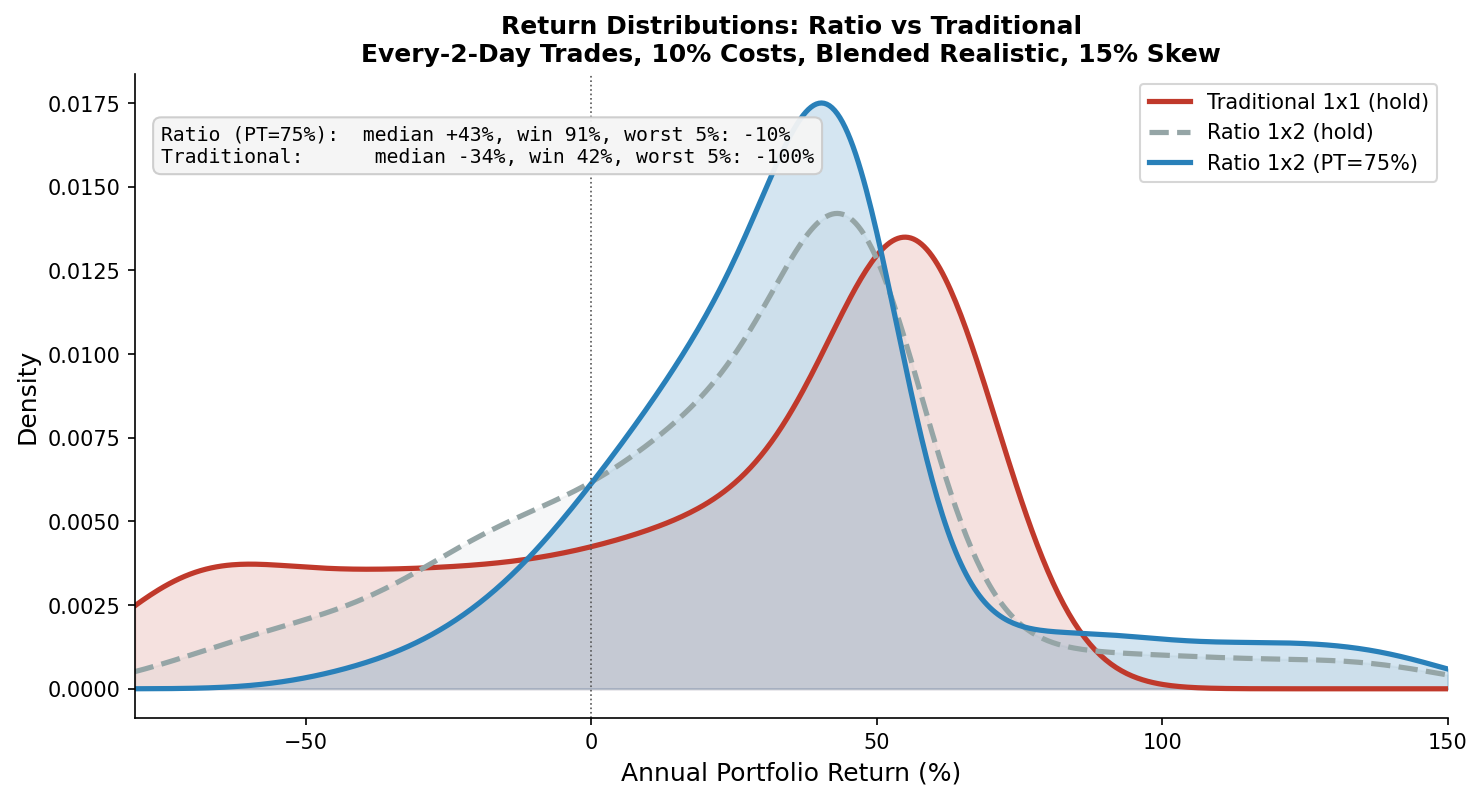
The blue curve (ratio with PT=75%) is sharply peaked with almost no left tail. The gray dashed curve (ratio, hold to expiry) has the same median but a much wider spread. The red curve (traditional) is centered near zero with a fat left tail extending to -100%.
Key patterns from the heatmap:
-
Very tight stops (10-50%) are uniformly terrible. Returns are -6% to -13% regardless of PT. The spread barely has time to breathe before getting stopped.
-
Even moderate stops (100-150%) lose money. The ratio spread’s loss valley is deep — you need to let the trade pass through it.
-
300% SL is the first stop level that works, but still far below no-SL.
-
No stop loss wins — both for median returns and worst-case outcomes.
Part 4: Trade Frequency
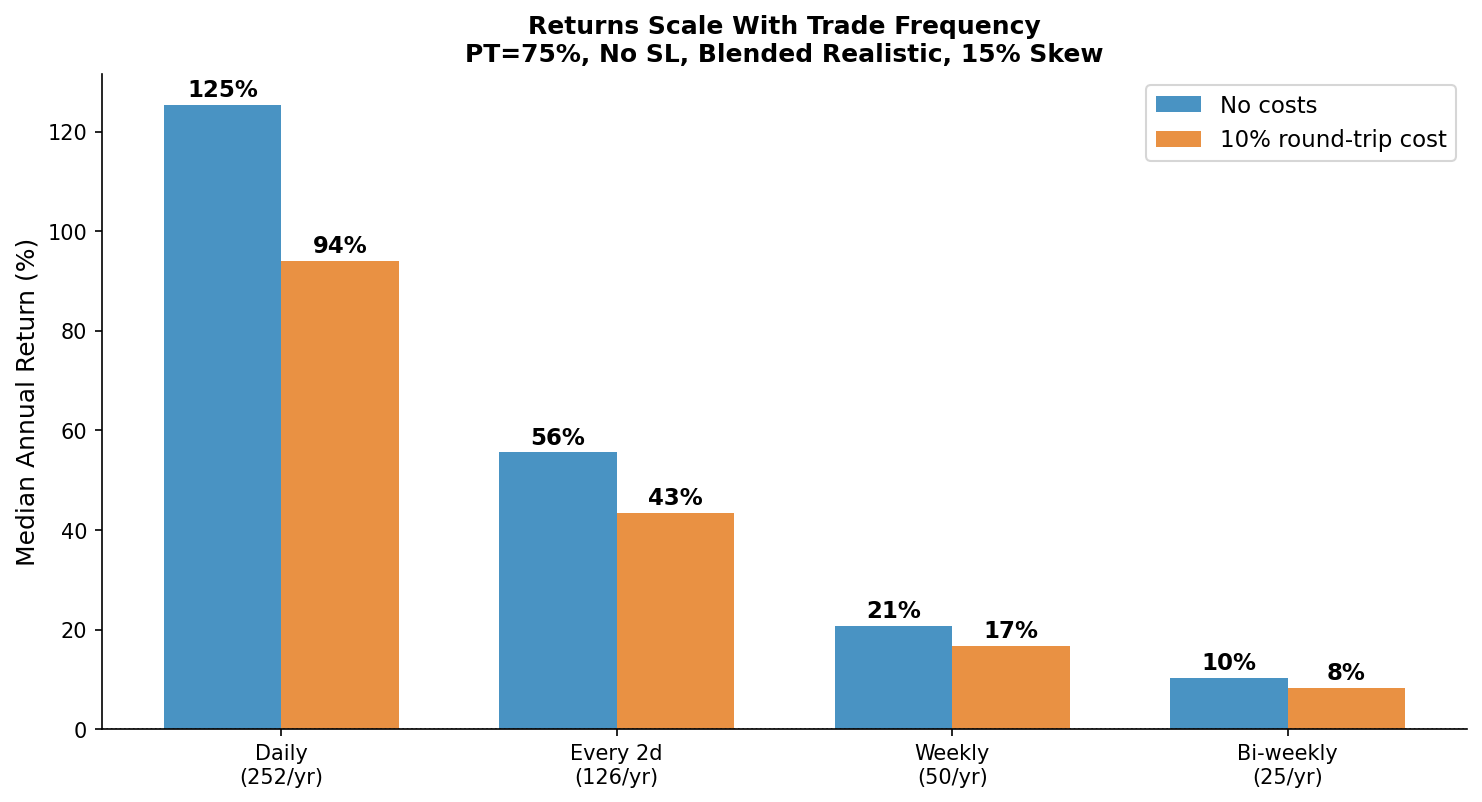
Returns scale almost linearly with trade frequency:
| Frequency | Trades/Year | Return (no costs) | Return (10% costs) |
|---|---|---|---|
| Daily | 252 | +125% | +94% |
| Every 2 days | 126 | +56% | +43% |
| Weekly | 50 | +21% | +17% |
| Bi-weekly | 25 | +10% | +8% |
The realistic range is 8-43% annual return depending on how often you trade and how tight your execution is. Transaction costs take a roughly constant bite at each frequency.
The theoretical edge exists, but friction — bid-ask spreads, commissions, capital constraints, execution speed — determines how much of it you actually capture. The 100%+ returns at daily frequency assume zero friction, which doesn’t exist.
Part 5: Should You Use Stop Losses?
“Cut your losers short” is standard advice. But ratio spreads have convexity — they pass through a loss valley before the long options kick in. A stop loss that triggers during the valley kills the recovery.
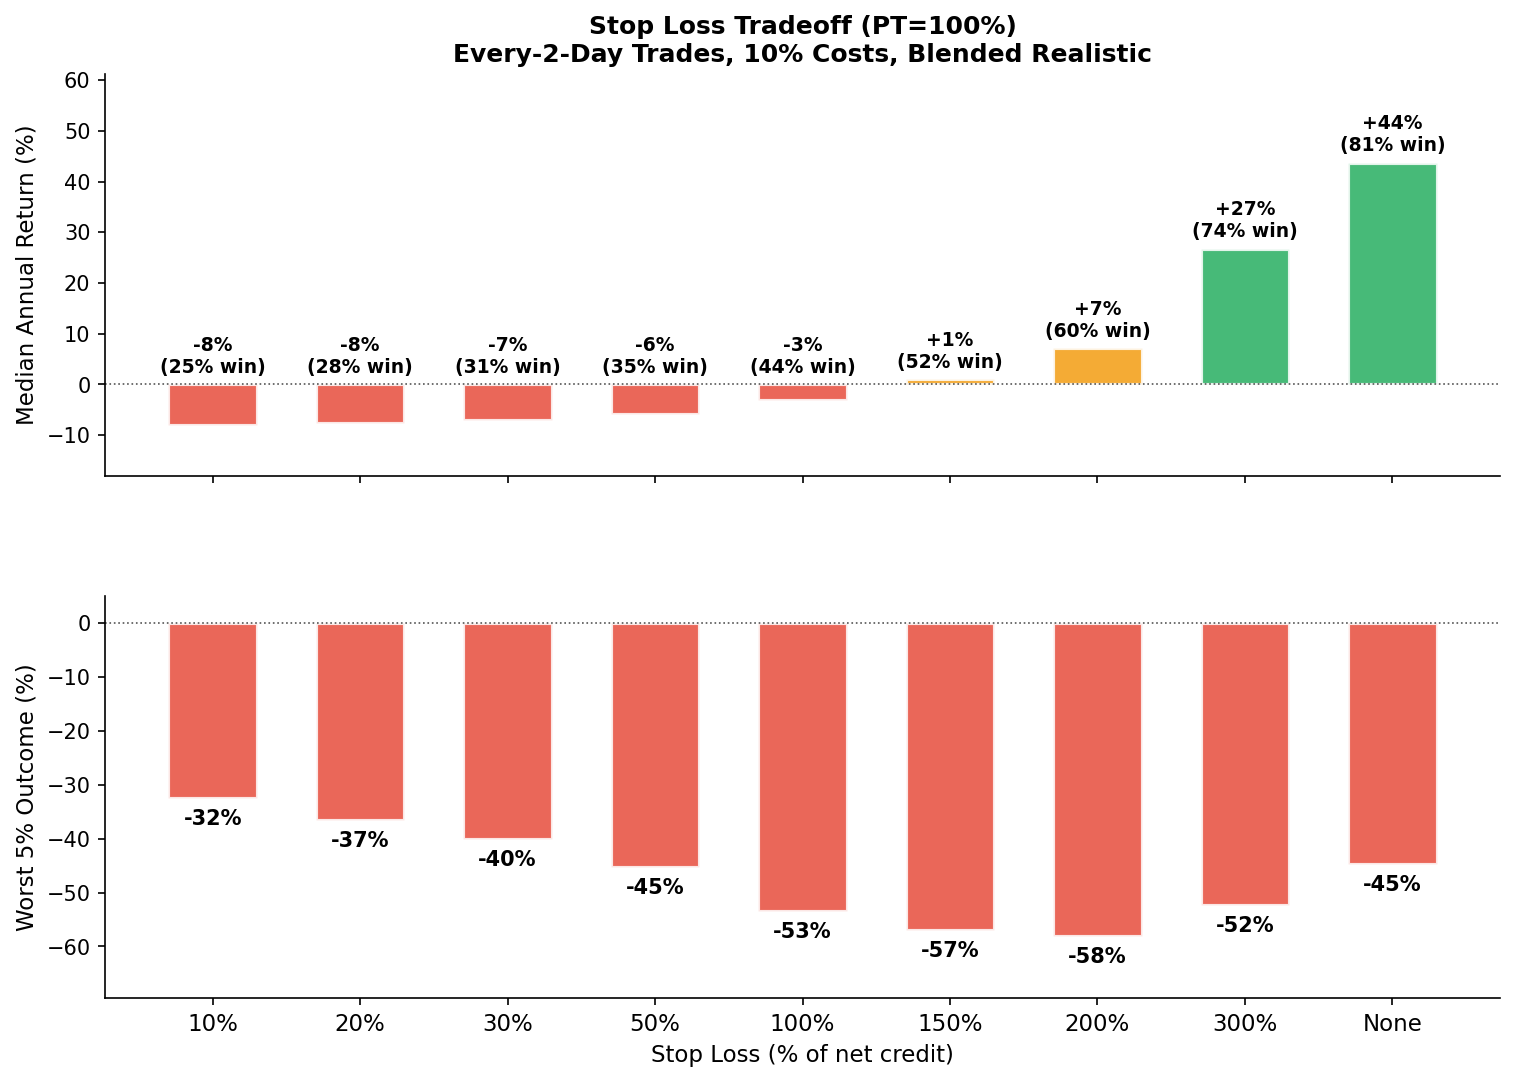
We tested every stop from 10% to 300% of credit:
| Stop Loss | Median Return | Win Rate | Worst 5% |
|---|---|---|---|
| 10% | -8% | 25% | -32% |
| 20% | -8% | 28% | -37% |
| 30% | -7% | 31% | -40% |
| 50% | -6% | 35% | -45% |
| 100% | -3% | 44% | -53% |
| 200% | +7% | 60% | -58% |
| 300% | +27% | 74% | -52% |
| None | +44% | 81% | -45% |
Stops at 10-50% of credit are the worst of both worlds: they trigger on nearly every trade, lock in small losses repeatedly, and don’t even protect your worst case. Even a 200% stop hurts more than it helps.
In practice
The simulation assumes continuous prices and perfect fills. Real markets have overnight gaps, wide spreads during fast moves, and margin calls.
-
Size conservatively. At 2% risk per trade with ~5 overlapping, your max exposure is ~10% of portfolio. Even a 400% credit loss on one trade is a manageable 8% portfolio hit.
-
If you need a stop, make it wide (300%+). Tighter stops are in the dead zone: they trigger often, lock in losses, and don’t even improve your worst-case.
-
Position sizing is your real risk management. The no-stop result works because each trade is small relative to the portfolio.
Summary
| Metric | Traditional 1x1 | 1x2 Ratio Spread |
|---|---|---|
| Median Annual Return | -44% to +31% (depends on IV/RV) | +11% to +79% (depends on IV/RV) |
| Best Environment | Calm market, high IV | Volatile market, any IV |
| Optimal PT / SL | – | PT=75% of credit, No SL |
Five Takeaways
-
Ratio spreads beat traditional spreads in most conditions, but not all. When the market stays calmer than implied vol suggests, the traditional spread’s larger credit wins. The ratio spread’s edge comes from occasional large moves — which is most of the time in equity markets.
-
Take profits at 75% of credit. 91% win rate, -11% worst case, and only 1% less median return than holding to expiry. The tightest return distribution of any setting we tested.
-
Stop losses hurt this strategy. Every stop level from 10% to 200% was net negative. The spread needs to pass through its loss valley to reach the convexity payoff. If you must use a stop, 300%+ is the minimum.
-
The edge is real but capped by friction. Weekly trading with costs: ~17% annually. Every-2-day: ~43%. The more you trade and the tighter your execution, the more you capture.
-
Vol skew matters but doesn’t kill the edge. Even at 30% OTM vol premium (steep skew), the ratio spread returns +31%. The strategy is robust across realistic skew levels.
Based on these findings, Helium uses ratio spreads with PT at 75% of credit, no hard stop loss, and conservative sizing (2% risk per trade) as the default for our Short Volatility Trades.
Methodology: 5,000 Monte Carlo simulations, trades every 2 business days (~126/year, ~5 overlapping), 10% round-trip transaction costs (as % of credit). Black-Scholes pricing, r=0, 50-delta short, 10-delta long, 10-day duration. OTM vol premium tested at 0-30%. PT/SL grid tested from 10% to 300%+ of credit. Implied vs Realized vol surface: normal returns at each realized vol level, priced at each implied vol level. Results symmetric for put spreads.
Disclaimer: Options trading involves significant risk. This is for educational purposes only, not financial advice. Simulated performance does not guarantee future results. Actual returns depend on execution quality, market conditions, and transaction costs.