Use Helium’s optimized backtests to find profitable risk-defined options trading strategies for stocks & ETFs. Updated weekly.
Watch Video Explainer
View Top Backtests
How It Works
Using a balancing genetic algorithm, Helium searches for a rules-based options trading strategy optimized for a balance of the following:
-
High rate of return (high return on capital and geometric return)
-
Consistent returns over time
-
Small drawdowns
-
Large number of trades
-
Simpler trading strategy (less strategy parameters)
-
Small variance of returns
-
Big positive skew of returns
-
Small kurtosis of returns
-
Maximum defined risk for each trade
-
Cost efficient hedging based on implicit underlying & volatility correlation
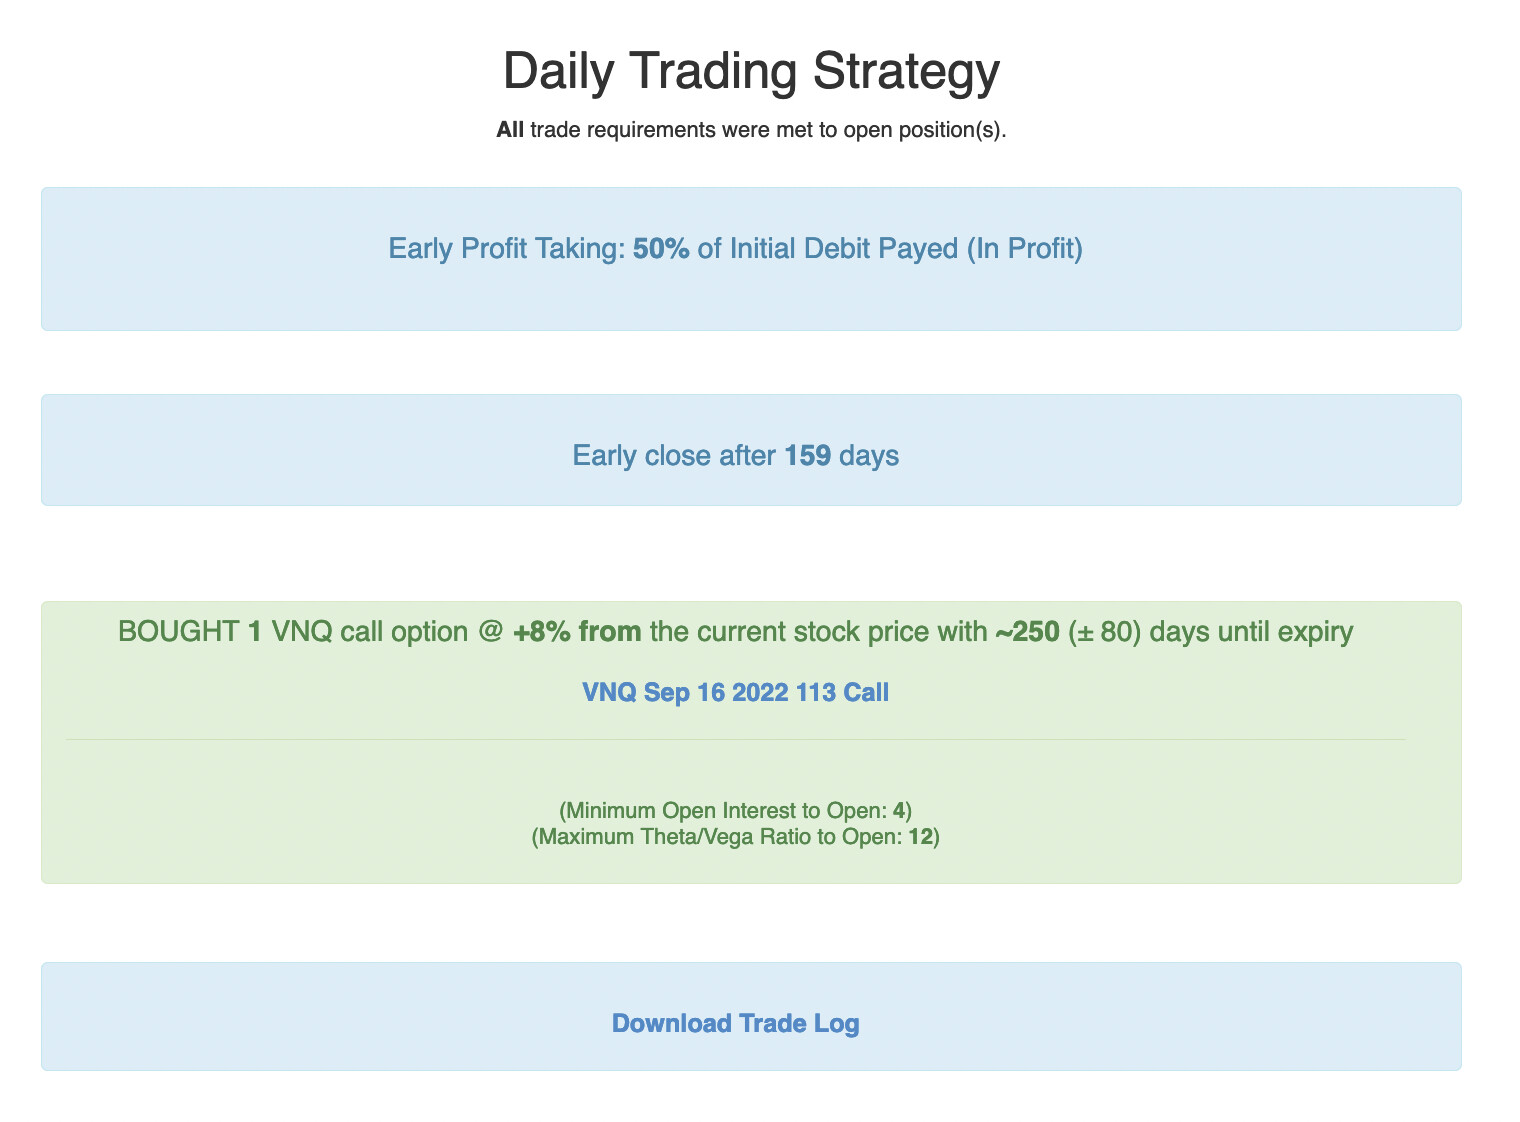
In addition to selecting which options to buy and sell, Helium also considers early profit taking, cutting losing trades early, implied volatility thresholds when opening trades, constraints on greek ratios (Gamma/Theta Ratio and Theta/Vega Ratio), and closing out after a set number of days. Unless a trade entry condition is unmet, Helium opens the same strategy every trading day.
Execute strategies with One Click Trade Execution: Automatic limit order algorithm to get filled at attractive prices.
Helium subscribers can see P/L over time, correlation between trade legs, strategy Sharpe ratio, full trade log, percent winning trades, correlation of underlying prices, a graph showing risk exposure to movement in the underlying (delta risk), a graph showing risk exposure to changes in implied volatility (vega risk), and a graph showing risk to time decay (theta risk).
Example Strategy:
Trading Strategy Return

The x-axis is retrospective time. The y-axis is strategy percent return.
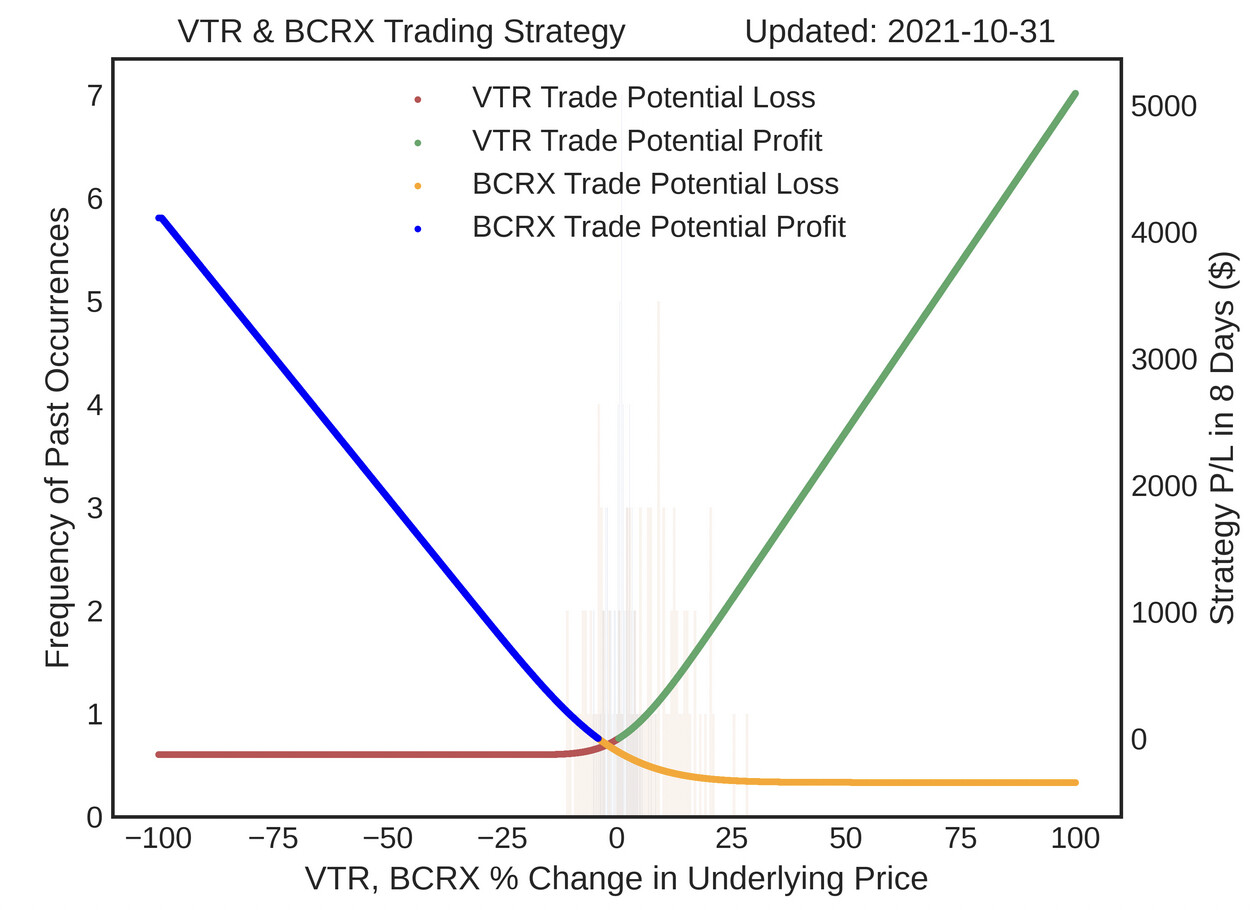
Delta Risk: Exposure to Movement of Underlying
In addition to simple trade implementation details, Helium displays a risk exposure graph (shown below) which shows the profitability of the strategy as a function of underlying price movement (delta risk).
Green & blue represent potential strategy profit; red and orange represent potential strategy loss. The x-axis is underlying percent price change at earliest option expiration. The y-axis is potential P/L.
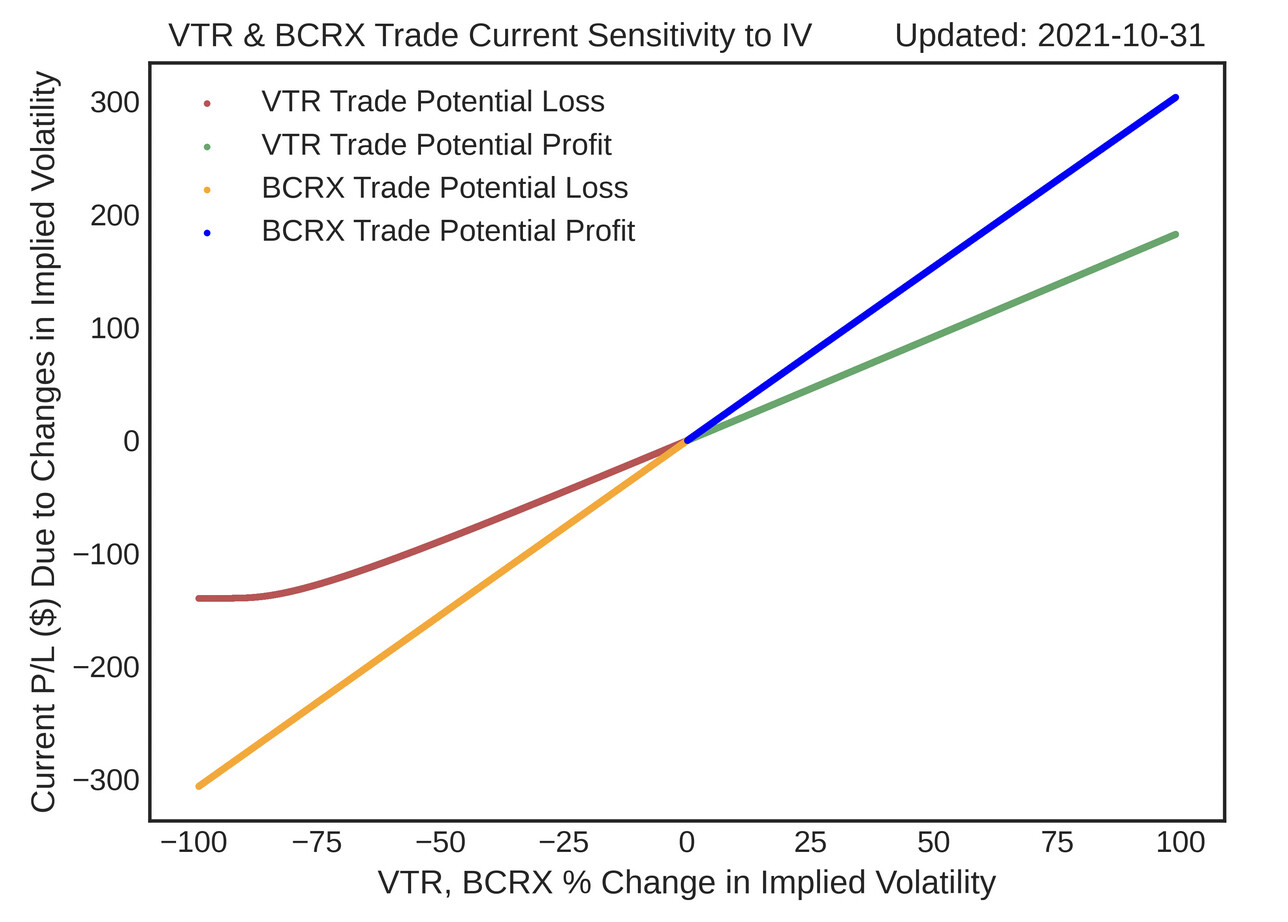
Vega Risk: Exposure to changes in implied volatility
Vega risk shows strategy risk exposure to changes in implied volatility, which is an expectation of future uncertainty. Since most of Helium’s backtests are long volatility strategies, these trading strategies will increase in value if uncertainty increases (increasing expectation of underlying movement).
Green & blue represent potential strategy profit; red and orange represent potential strategy loss.
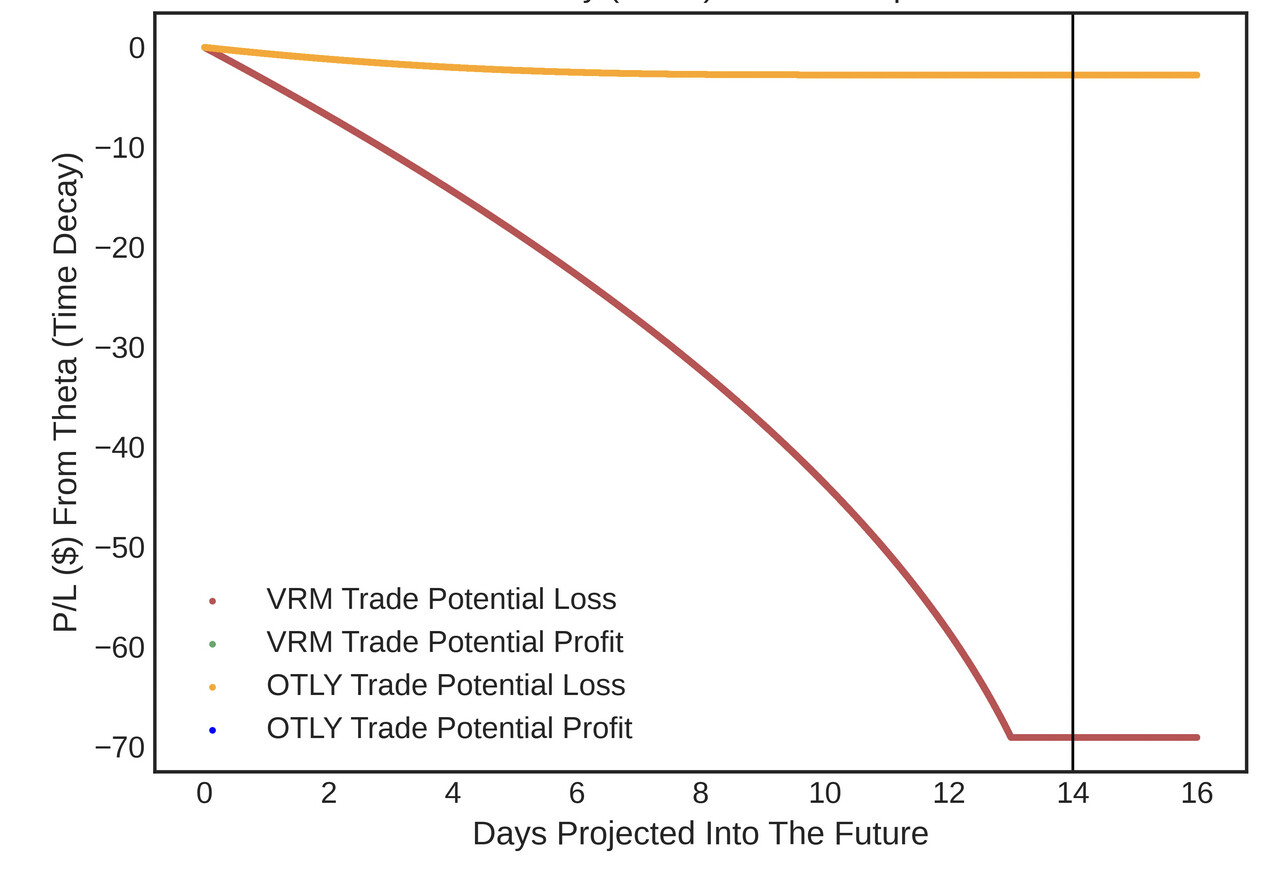
Theta Risk: Exposure to carrying cost
Theta represents risk exposure to the passage of time. Since most of Helium’s backtested strategies are long volatility strategies, these trading strategies will lose value over time (carry cost). Helium shows how options values could change over time, with all else being equal.
Green & blue represent potential strategy profit; red and orange represent potential strategy loss.
To backtest strategies, Helium opens a new position every trading day (unless a volatility or other strategy rule is unmet). For time spreads, Helium closes all positions at the first expiration date. Positions can be closed at the end of each trading day.
Since traders have different risk tolerances, Helium features multiple risk levels for each strategy, reflecting the maximum possible losses for each strategy.
Backtest Bias
A backtest is a trading simulation based on past pricing data that shows trading strategies that could have been profitable in the past. Since Helium’s backtests are not real trading, the results are subject to backtest bias a.k.a hindsight bias. This means that, retrospectively, this would have been a profitable strategy if repeated daily, but we had no way of knowing this beforehand! Although Helium’s genetic algorithm tries to filter out inconsistent trading strategies that “just got lucky,” it’s unknown whether strategies will continue to have the same returns. It’s prudent to interpret backtests as descriptive (this is what could have worked) instead of prescriptive (this will definitely work in the future).
To make our backtests more grounded and to better reflect liquidity/market risks, all Helium backtests buy near the ask price, sell near the bid price, and pay heavy transaction costs.