Get insights into future price movements with probabilistic distributions of price uncertainty over time.
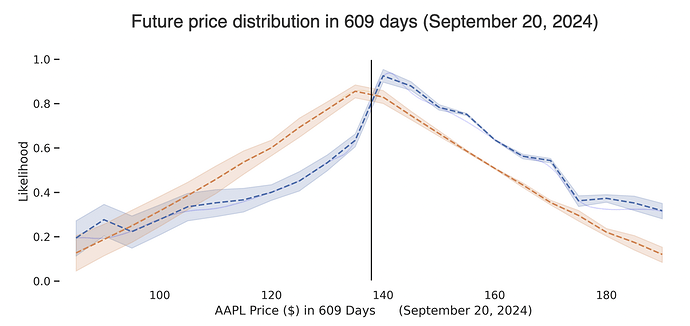
Easily compare Helium’s projected future price distribution to the market’s expected price distribution (as reflected in options prices). Updated daily.
Example Estimated Future Uncertainty
The x-axis represents potential future price in $. The y-axis estimates the likelihood of the price ending up at each potential price, where higher values mean more likely, and lower values less likely.
Discrepancies between Helium’s estimate, and the market’s current/historical estimate could indicate potential mis-pricings and an opportunity for profit.
However, always keep in mind that Helium’s expected likelihood is just an estimate. Given that all models are wrong, it’s prudent to not interpret the models too literally.
Since the map is not the territory, keep in mind that any expected distribution is merely a relative expression of uncertainty.
Term Structure
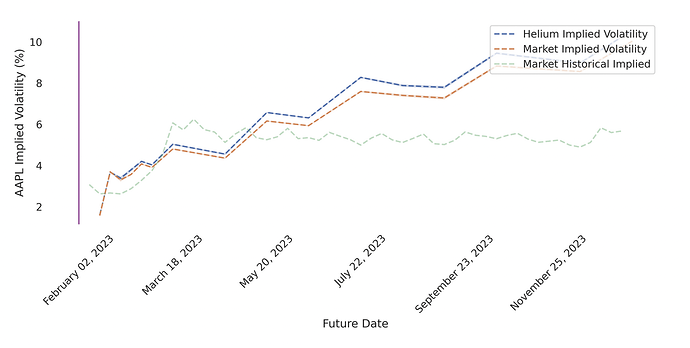
See how the market and Helium uncertainty changes over time by clicking on the “Term Structure” tab. Discrepancies between uncertainty over time could allow for profitable trades by buying volatility at one point in time and selling volatility at another point in time.
By comparing the difference between the blue line (Helium uncertainty) to the orange line (market uncertainty) we can see where uncertainty might be relatively mis-priced over time. By comparing the orange line to the green line (historical market uncertainty from past 160 days projected into the future) we can potentially make trades that profit from mean reversion.
Volatility Surface
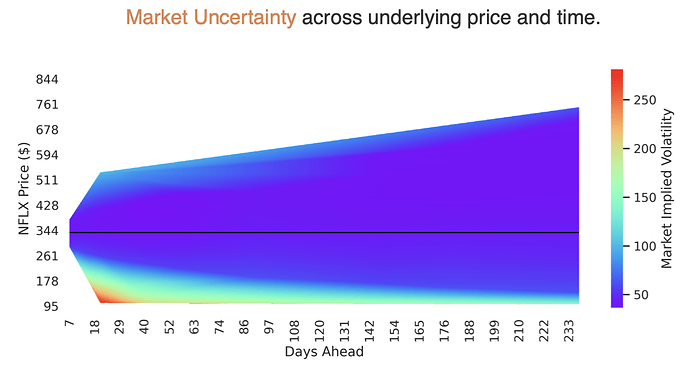
See how the market and Helium uncertainty change over both underlying price and time. The horizontal black line represent current underlying price.
Price Return Surface
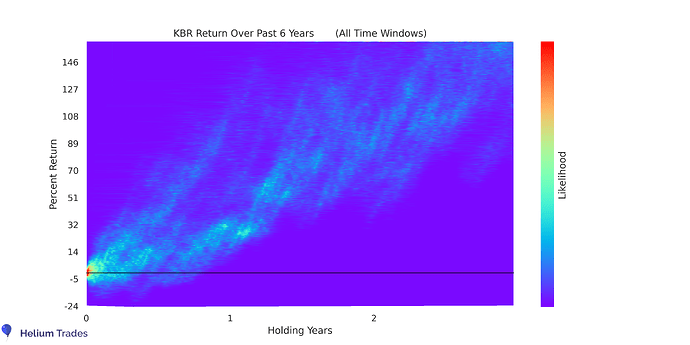
Helium’s return surface graphs let you assess investments without the luck of “timing the market”. By sampling returns over all possible time windows, you can arrive at a more general reflection of returns. Easily see a historical estimate of returns for given holding periods, no matter when you enter/exit an investment.


