In this guide, we’ll show you how to use Helium to trade uncorrelated assets, donating our $253.83 in profits to the Ocean Conservancy.
Why trade uncorrelated assets?
If stocks A & B are uncorrelated, this means that (under normal market conditions) there is no significant relationship between the price of A and the price of B. If the price of A dropped, we would have no reason to suspect that B would move either up or down (and vice-versa). Grouping together uncorrelated assets into a portfolio (a form of diversification) allows us to reduce our portfolio risk by reducing the likelihood that all our positions move against us together.
Let’s get started.
Choosing Stocks from Helium’s Portfolio Architect
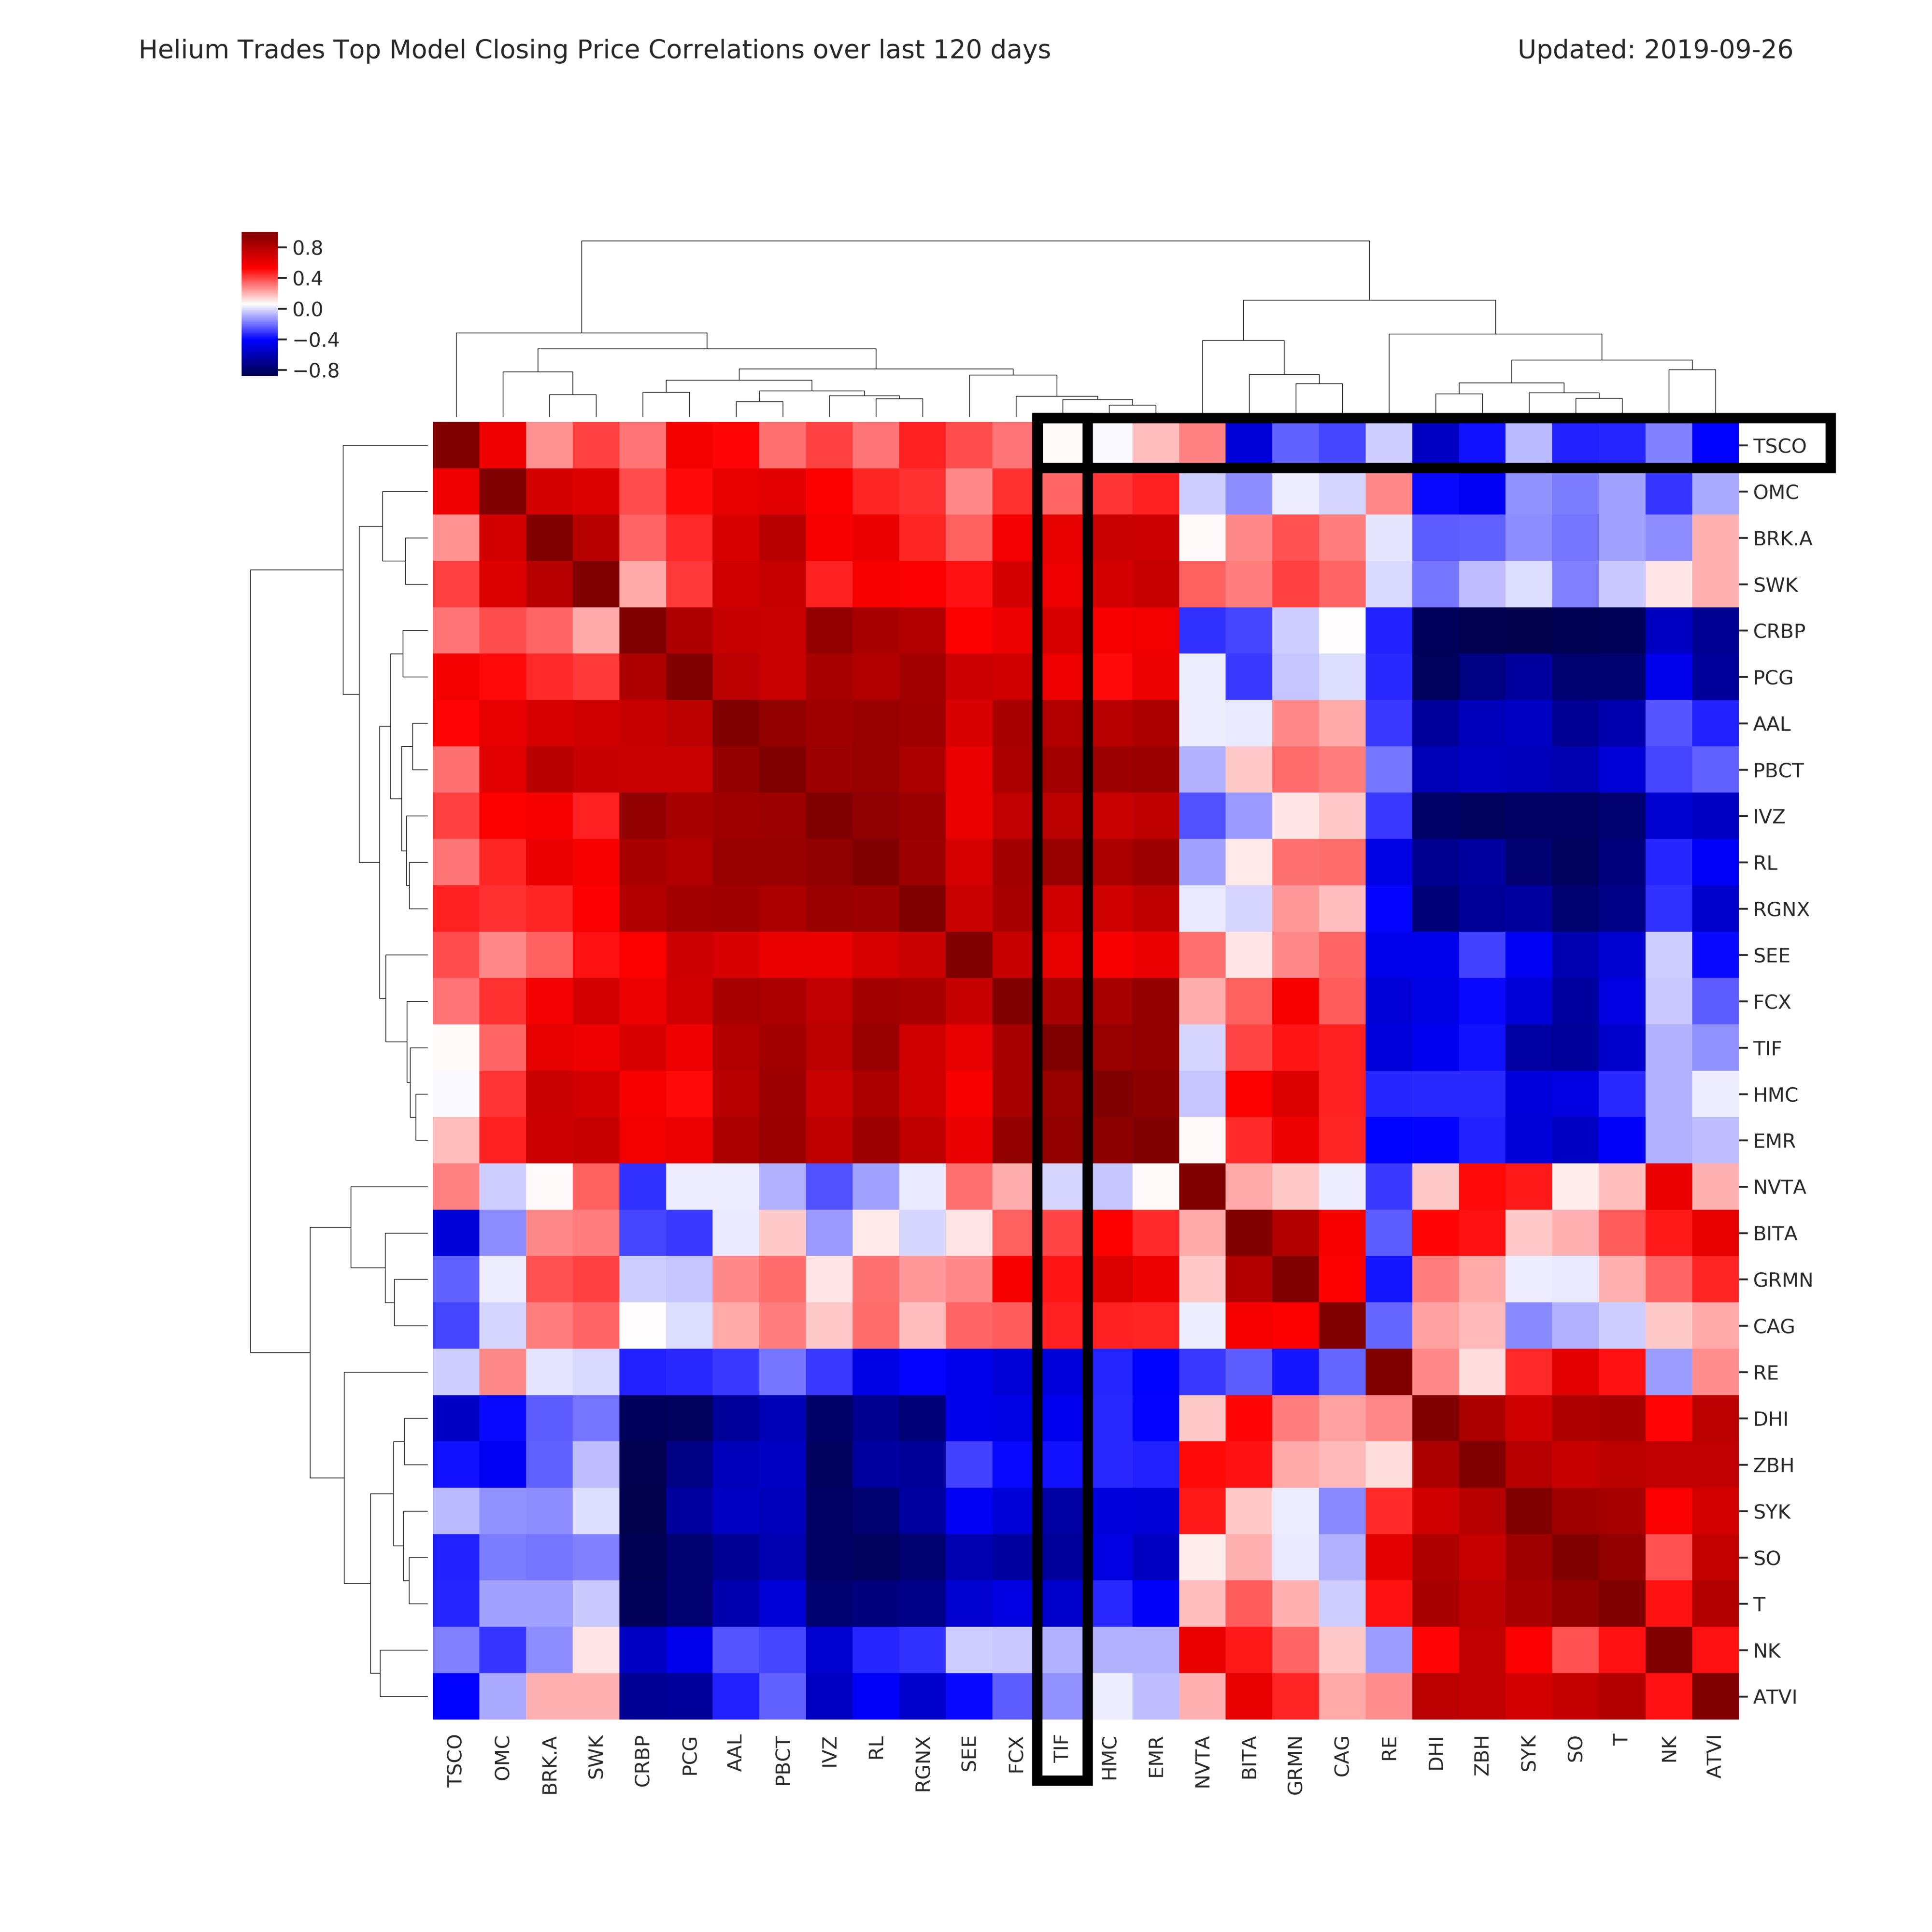
On September 27, 2019, we looked at Helium’s Portfolio Architect to get the following correlation matrix:
What the hell am I looking at?
The above correlation matrix represents the pairwise Pearson correlations of the underlying prices from Helium’s top performing forecast models. A dark red square indicates a positive linear relationship, meaning that the prices tended to move together over the last 120 days. A dark blue square means that the prices tended to be negatively correlated (moved in opposite directions) over the past 120 days. White squares indicate correlation close to zero, which means that the two stocks tended to move independently of one another. Additionally, Helium has a correlation matrix of high Implied Volatility to aid option sellers as well as a tool to build uncorrelated portfolios of three assets.
Choosing Stocks to Trade
We decided to trade TSCO & TIF for the following reasons:
-
TSCO & TIF are relatively uncorrelated, as indicated by the white square between them shown above. This will help reduce our portfolio variance.
-
When we opened these positions, the Helium model for TIF was bearish while the Helium model for TSCO was bullish— this allowed us to go short TIF and long TSCO in order to have a (relatively) market neutral portfolio.
Setting Up Our Trades
On September 27, 2019, here’s what the TIF options chain looked like:
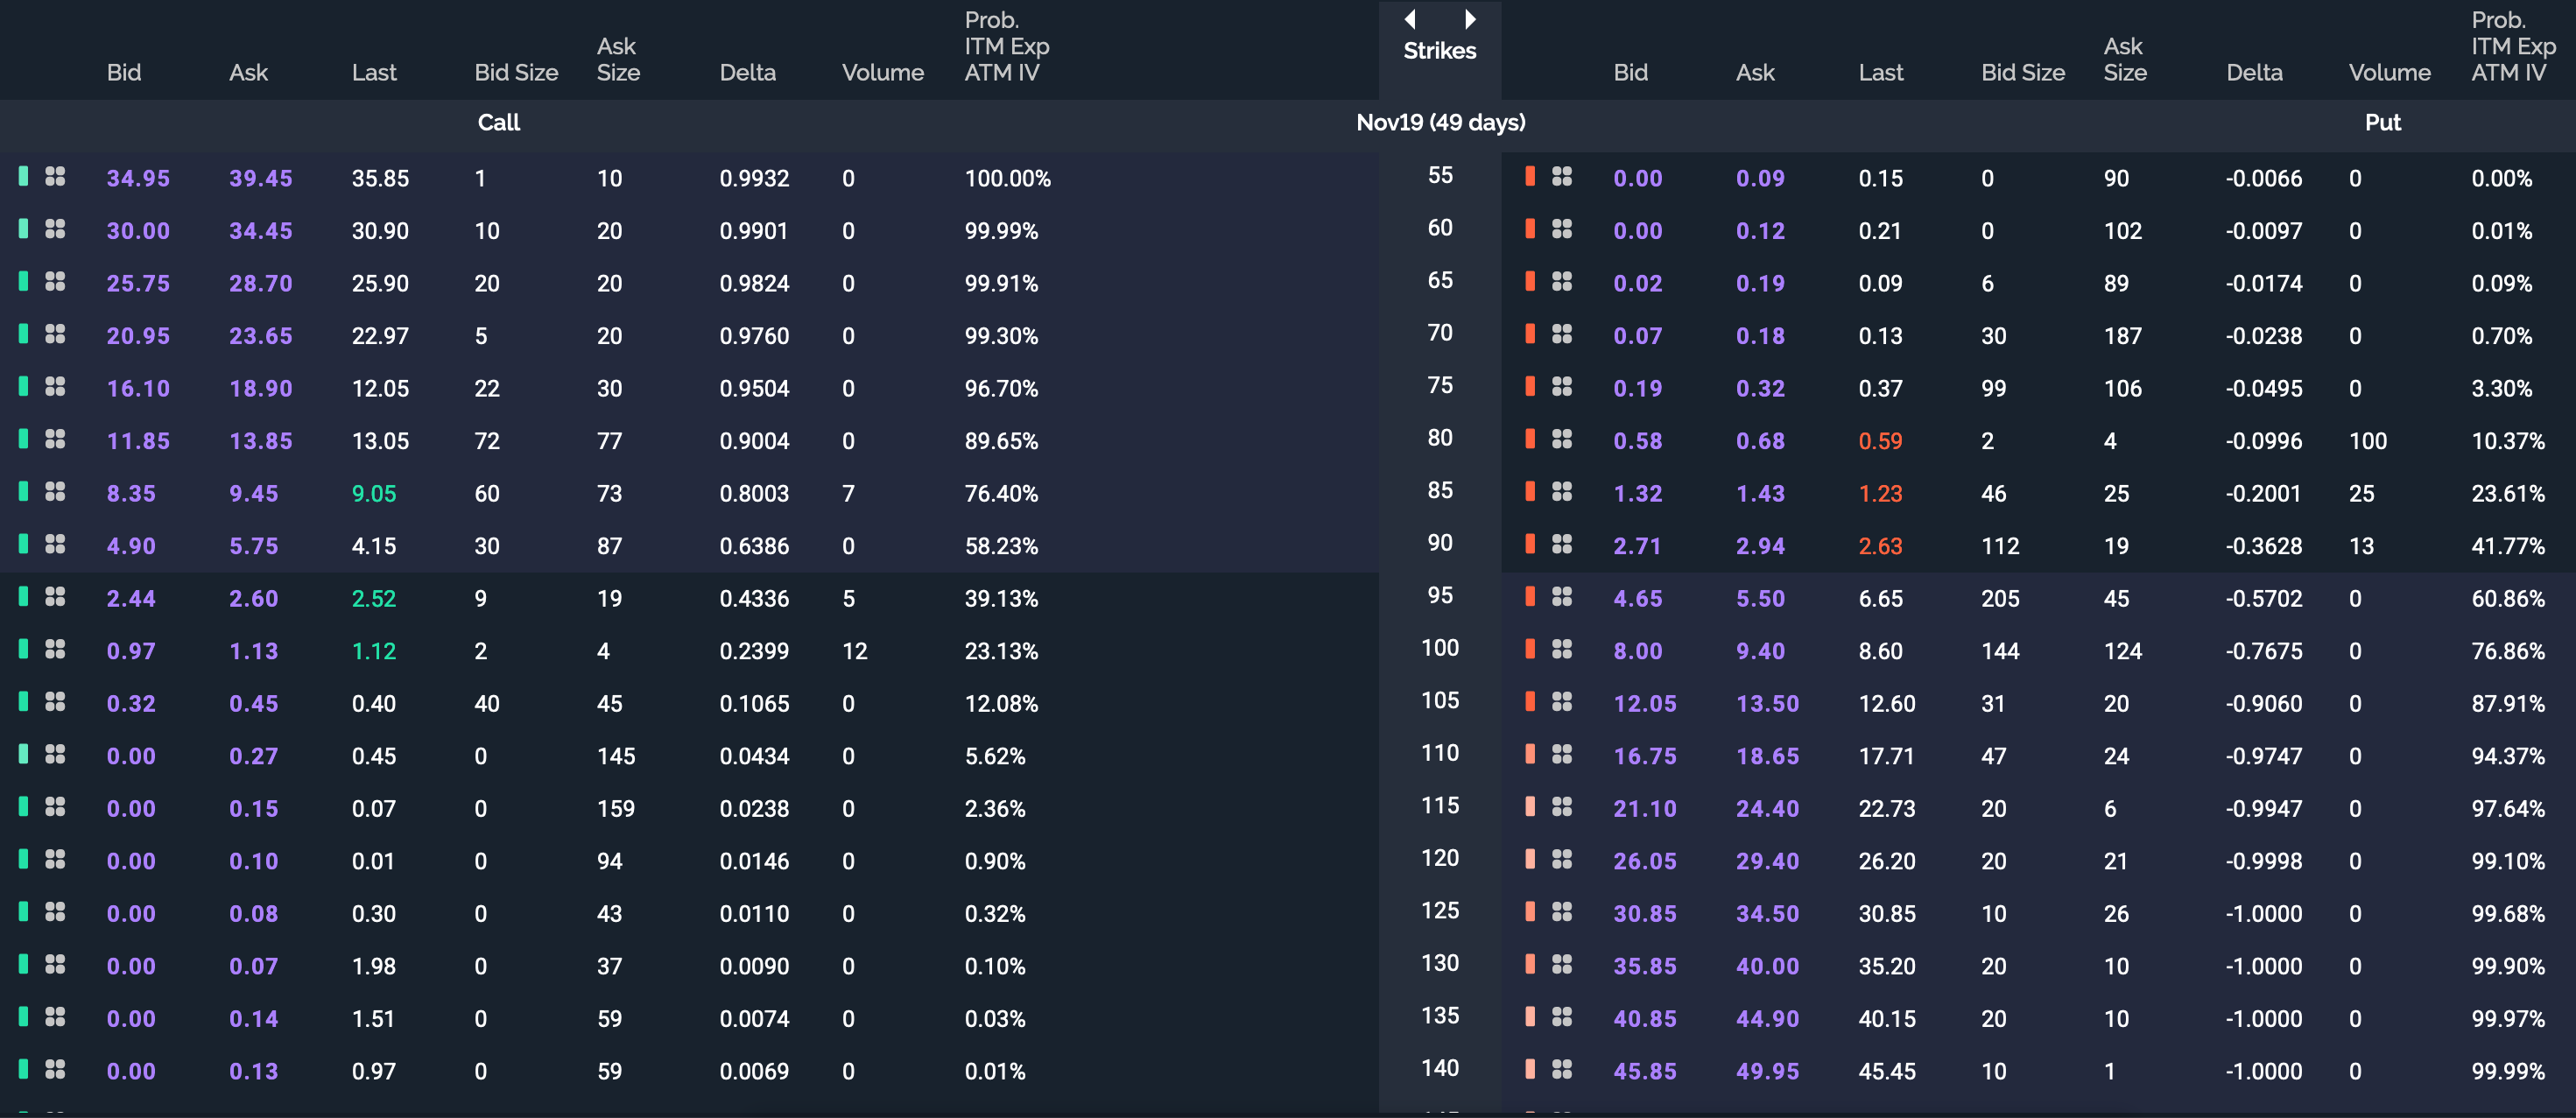
Since we were bearish on TIF, we sold an out of the money call option— a potentially profitable trade at expiration as long as the underlying price stayed below our short strike. We sold an expensive call option ($100 strike), and bought a cheaper one ($110 strike) in order to limit our downside risk. This is called a bear call spread. Here’s what the E*trade snapshot analysis looked like:
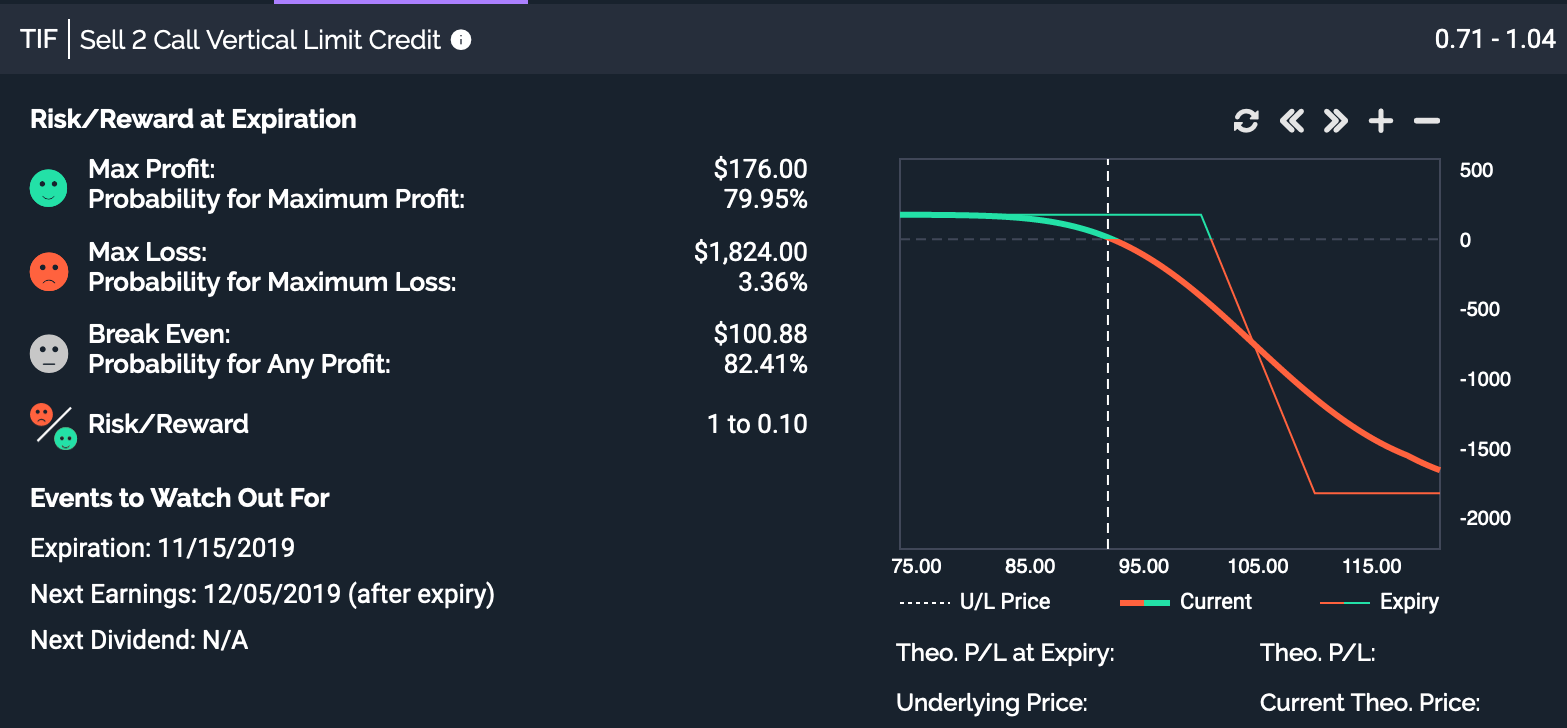
While we usually would like to receive more than a $176 credit, this trade has about an 80% chance of success if held until expiration; however we closed early which further increased the probability of success. A quick, back-of-the-napkin expected value is: $176 credit * 0.7995 chance of success — $1824 downside * 0.0336 chance of max loss = + $79.43. Since we were comfortable with a max loss of $1824, we opened the position.
Opening Our Second Trade
Here’s what the TSCO options chain looked like when opening our position:
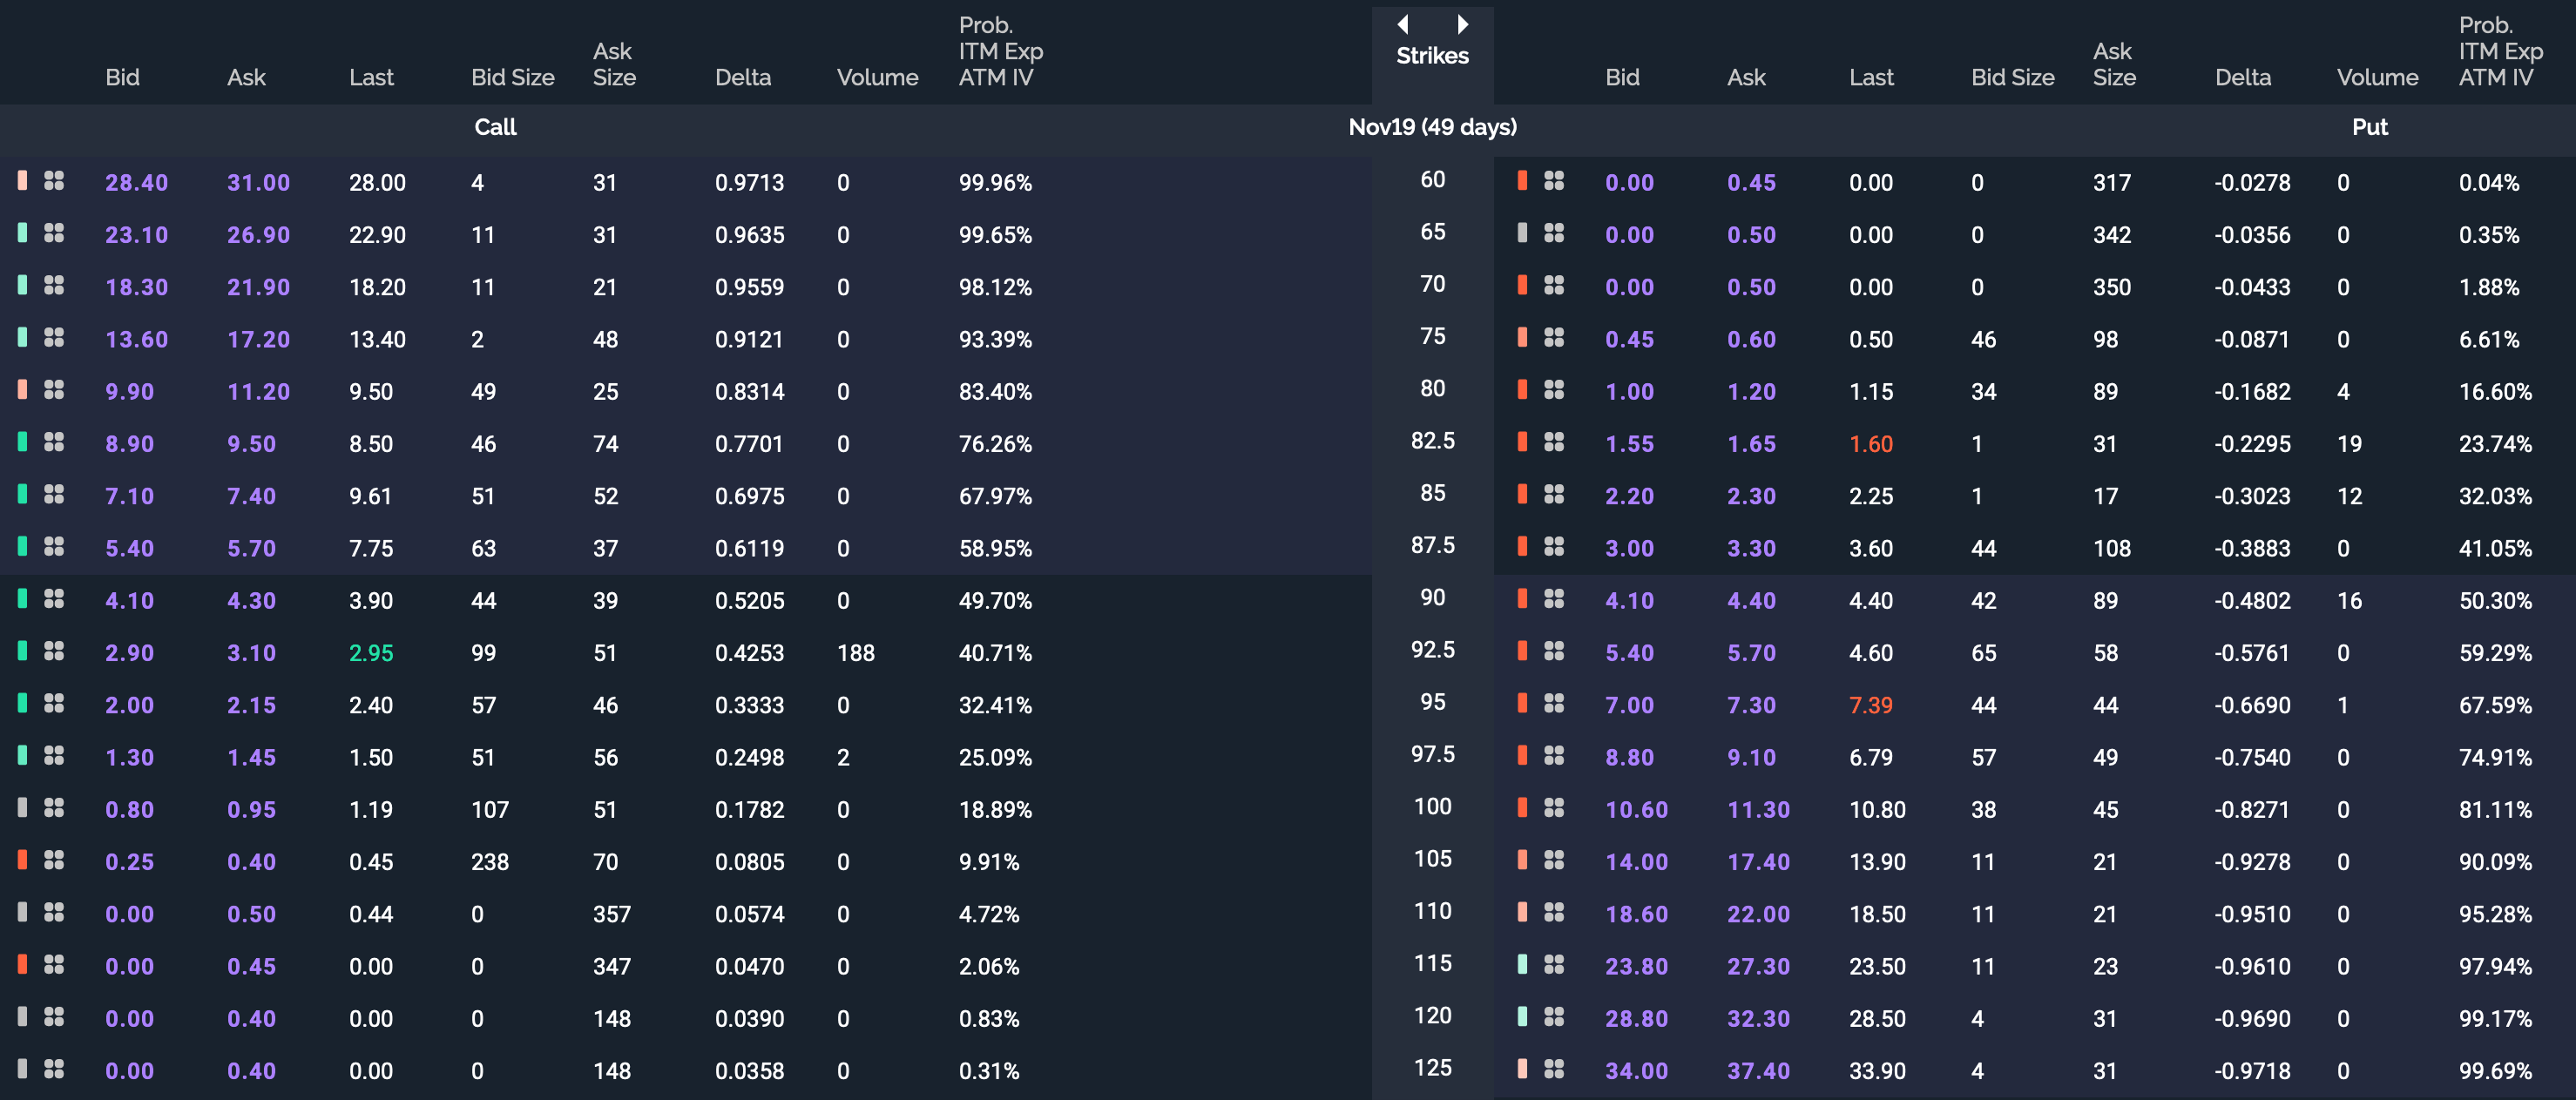
Since we were slightly bullish on TSCO, we sold an expensive put option ($85 strike) and bought a cheaper one ($80 strike) to limit our risk— exactly the same idea as the TIF trade but with puts instead of calls. Here’s what the snapshot analysis looked like:
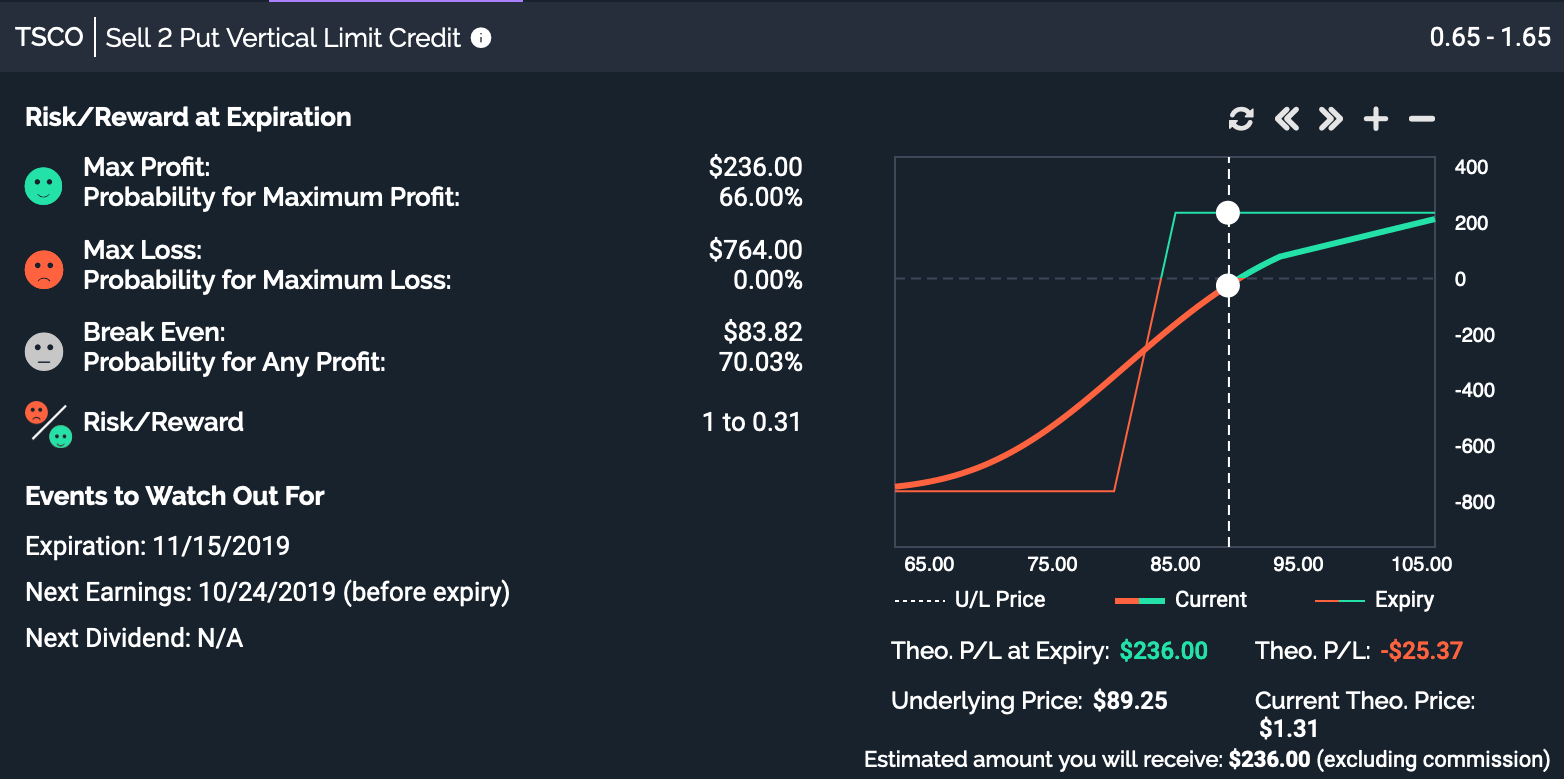
Since we were comfortable with a max loss of $764, we opened the position.
By choosing uncorrelated stocks, we were able to reduce our portfolio risk. Similarly, we were able to reduce our market risk by trading one long position and one short position. Ideally, we want a delta-neutral position (not directionally long or short) so that we can make money off of options decreasing in value over time. We achieved this by having similarly sized positions in both directions. (Our portfolio was slightly delta-positive, however close enough to zero that we didn’t worry about it). Making smart, diversified, and defined-risk trades is more important than having a perfectly balanced portfolio.
Even though TSCO & TIF are historically uncorrelated, it’s important to be aware of black swan events: unexpected events that could result in historically uncorrelated assets quickly becoming highly correlated. No pain, no premium.
Managing Our Positions
We only held these positions for 3 weeks before closing out. During that time, we occasionally looked at our positions to make sure nothing was going horribly wrong, however were careful not to succumb to loss aversion and close out early at a guaranteed loss. These two trades will make money off of decaying time value, not us trying to get fancy and constantly adjusting our positions.
Final Results
On October 18, 2019 we closed our two positions. Here’s the final results:
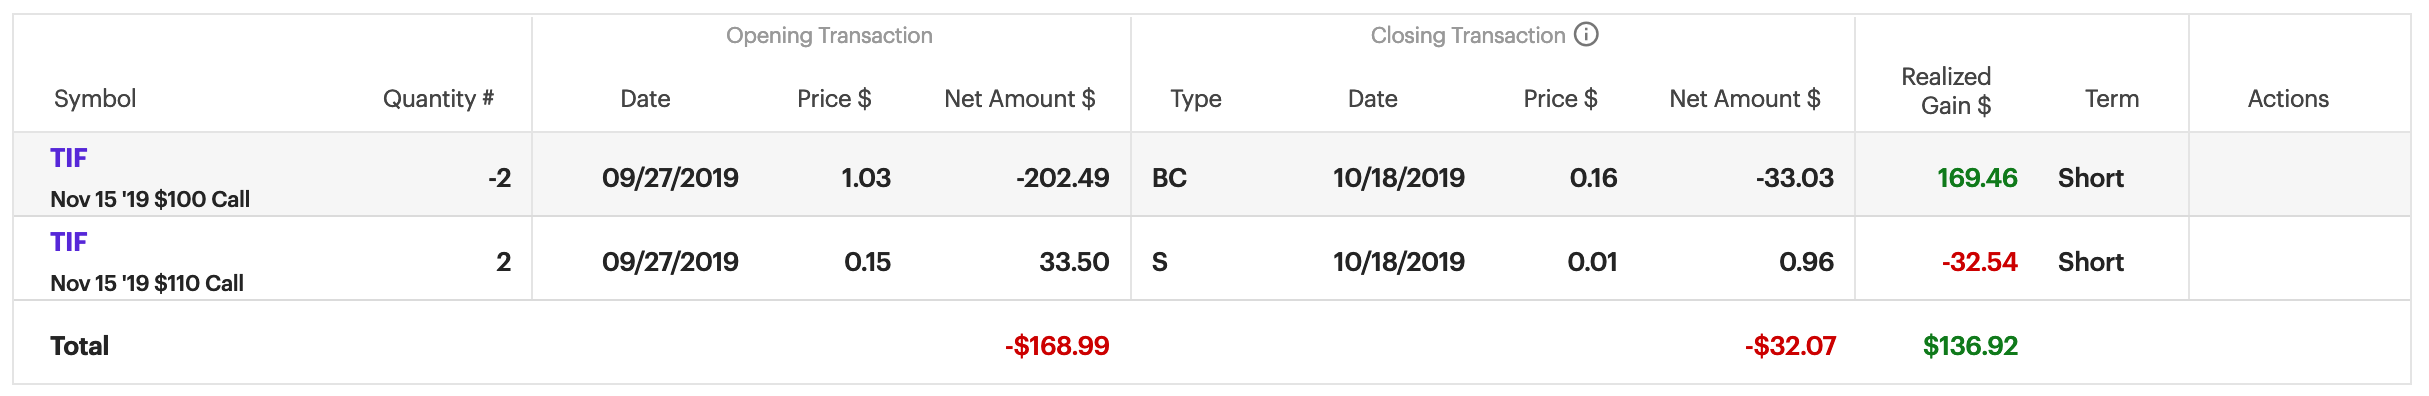
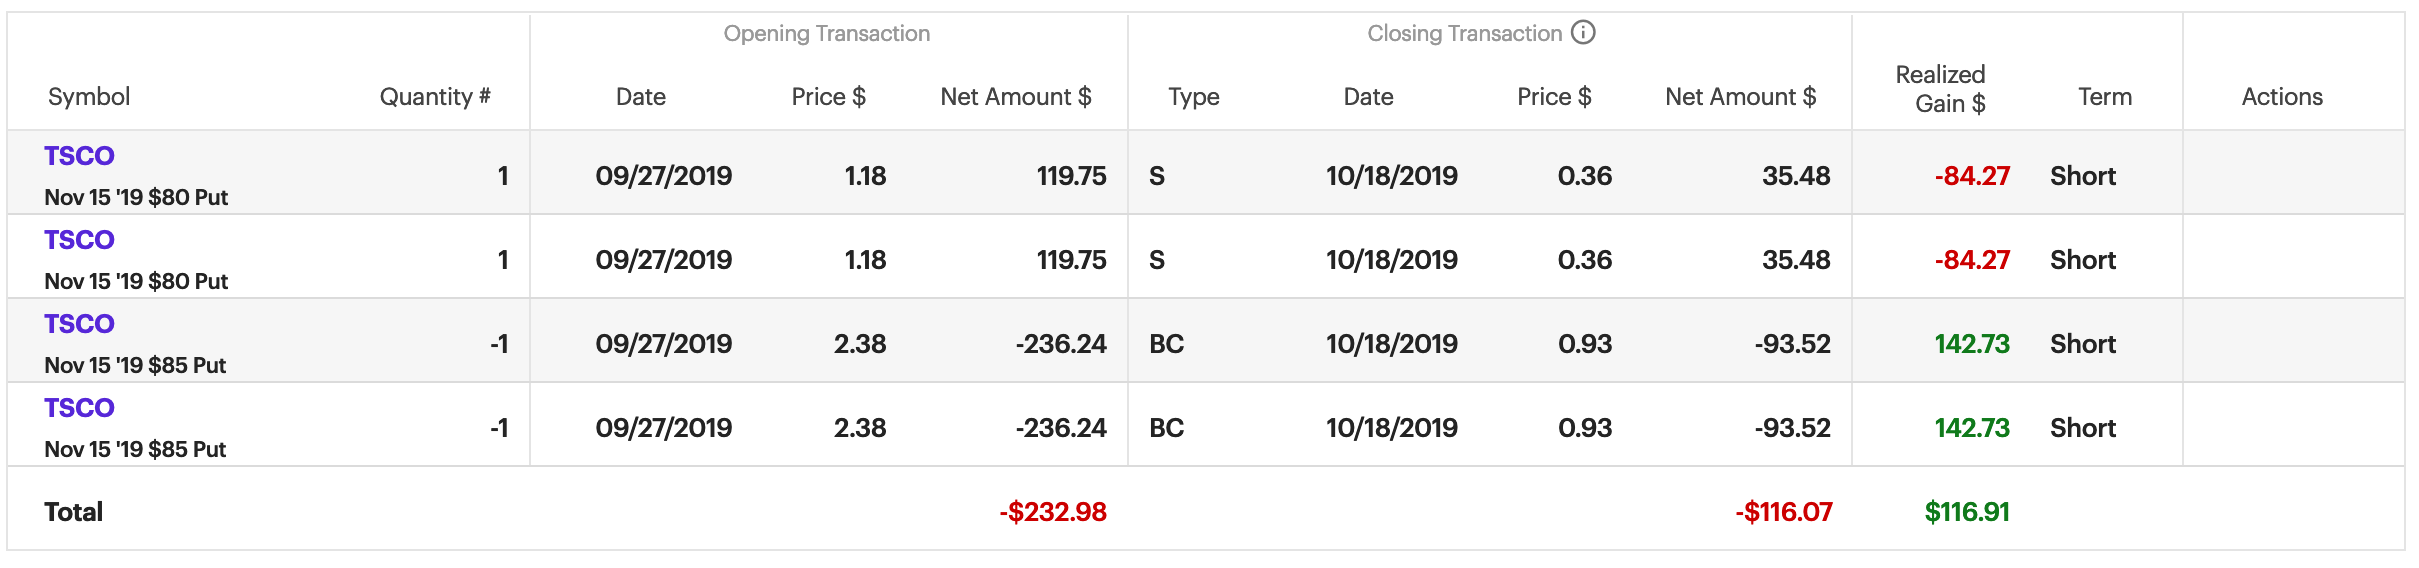
Total Profit: $116.91 + $136.92 = $253.83
Donating Profits
For this guide, we donated the $253.83 to the Ocean Conservancy.
Ocean Conservancy is working with you to protect the ocean from today’s greatest global challenges.
Together, we create science-based solutions for a healthy ocean and the wildlife and communities that depend on it.

Until next time,
Helium Trades
*Disclaimer: Nothing on Helium Trades or our blog constitutes investment advice, performance data or any recommendation that any particular security, portfolio of securities, transaction or investment strategy is suitable for any specific person. Helium Trades is not responsible in any way for the accuracy of any model predictions, price data, or trading.Any mention of a particular security and related prediction data is not a recommendation to buy or sell that security. Investments in securities involve the risk of loss. Past performance is no guarantee of future results. Helium Trades is not responsible for any of your investment decisions. You should consult a financial expert before engaging in any transaction.